Welcome to WordPress. This is your first post. Edit or delete it, then start writing!
Blog
-

A Sea Change is Underway
A sea change is underway and from what I see most organisations are not prepared for it, and in some cases don’t want to hear about it.
Most are confronting multiple strategic initiatives in play, changing systems architectures, automated decision-making, shifting markets, and increasing regulatory pressures. Each may be manageable in isolation, yet together they change the operating system of the business.
The greatest risk is not the change itself, it’s the gradual loss of visibility, coherence and control as successive waves of change alter structures, processes, systems, dependencies and accountability. Change is happening faster than most organisations can make sense of the impact and combined effect.
History shows us that organisations don’t always stumble and fail because they lack capability. Some fail because previous success creates complex structures, systems and ways of working that become increasingly difficult to challenge and adapt. Confidence can remain high even as organisation coherence is being eroded.
If coherence and visibility are becoming harder to maintain, we should be having a conversation about what is getting in the way and how to overcome it.
-
From GraphXR to Kineviz (2021-2026)
You may have seen recently that the platform that was formerly known as GraphXR, the modelling, analytical and data visualisation platform from Kineviz is now simply renamed as Kineviz. The recent triggering of this event has given me an opportunity to reflect on my journey so far and to look at the exciting future direction.
So why do we use Kineviz. 3D data visualisation is certainly addictive but it can take the unitiated time to understand and appreciate what they are seeing. This is normal. It’s like going to a remote location and seeing the broad night sky properly for the first time, you see variations and patterns but there can be so much going on that it takes time to soak it all in.
Having personally come from a 3D CAD/CAM/CAE background with forays into Plant Design, animation and GIS projects then this for me was a logical progression. Back in 2021 there were a few people dabbling in 3D in graph but no one was doing it well, that was until I met Wei and Sony at Kineviz.
So in this short blog I hope to take you on a short journey on how applying these tools to solve complex problems, in this case using existing government tabular data to demonstrates the ability to build an interactive data model, map spatial information and also link mineral deposits without requiring deep technical expertise. Ultimately, I hope to illustrate a technological leap that allows users to transform massive, disconnected datasets into actionable visual insights.
I wanted a model that a lot of people would have limited exposure to, a model that I created early on in my Kineviz relationship that had a number of people around me at the time wondering if I had lost the plot. Why would you ever want to create a model that contained over 30,000 nodes and what could you possibly gain from doing this?
The first question was an easy one to answer and that was to simply explore if I could create a “usable model” that large, and my response to the second question was I really had no idea but it seemed like a great idea at the time. For those that had been experimenting with large data sets and trying to use Bloom from Neo4j around the same time period you would know how limiting this was being locked in a 2D world (there are only so many nodes you can display on a screen in 2D and still making sense of them.
This model was to reated to better understand Mining Tenements in Western Australia. A mining tenement is an official license, permit, lease, or government authorization that gives a person or company the legal right to explore for, develop, or extract mineral resources on a specific piece of land.
The data part was the easy bit. The West Australian government through their mining oversights operation is currently known as DMIRS (Department of Mines, Industry Regulation and Safety) and they update the tenement data daily. Not having a mining background I had some very simple questions to ask like “What does the ownership of a tenement look like?” Was it one-to-one, or one-to-many? One owner to multiple tenements or potentially multiple owners of a single tenement? This question was answered by downloading a csv file and loading this into GraphXR and the journey began. Could I have done this using Excel or Power Query? Yes, but only for the simple initial questions, but more importantly they don’t look this good?
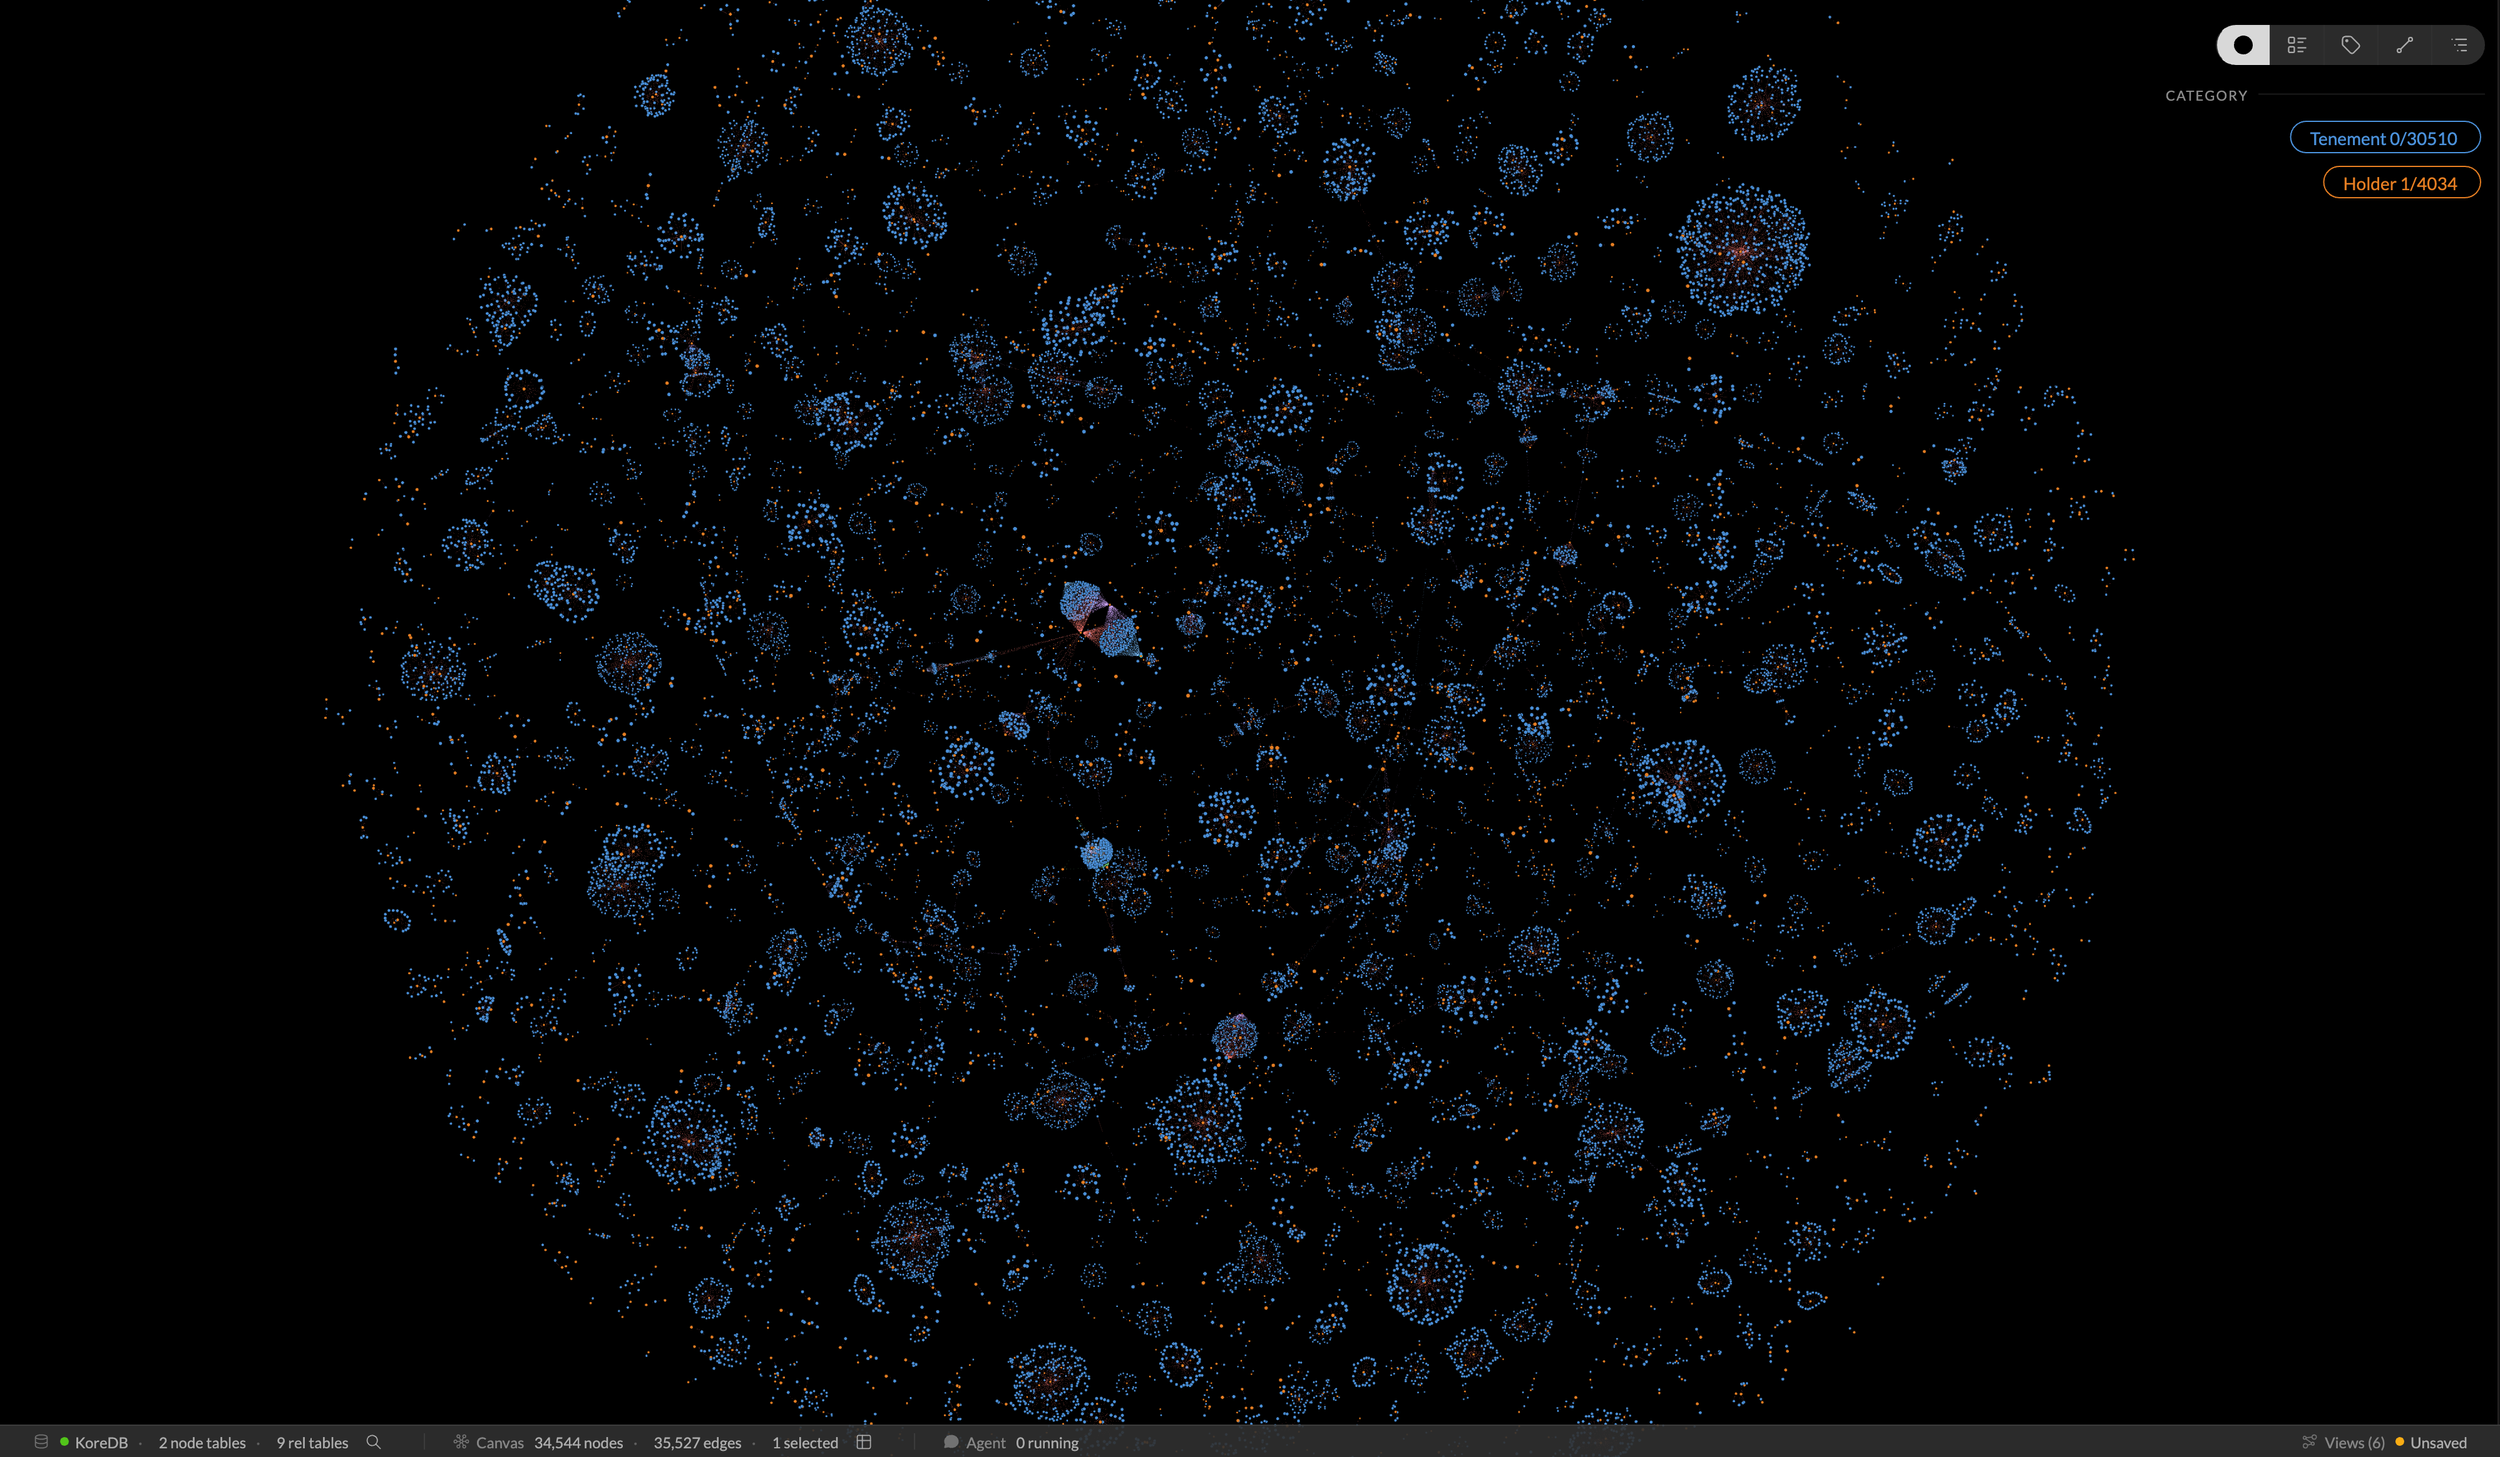
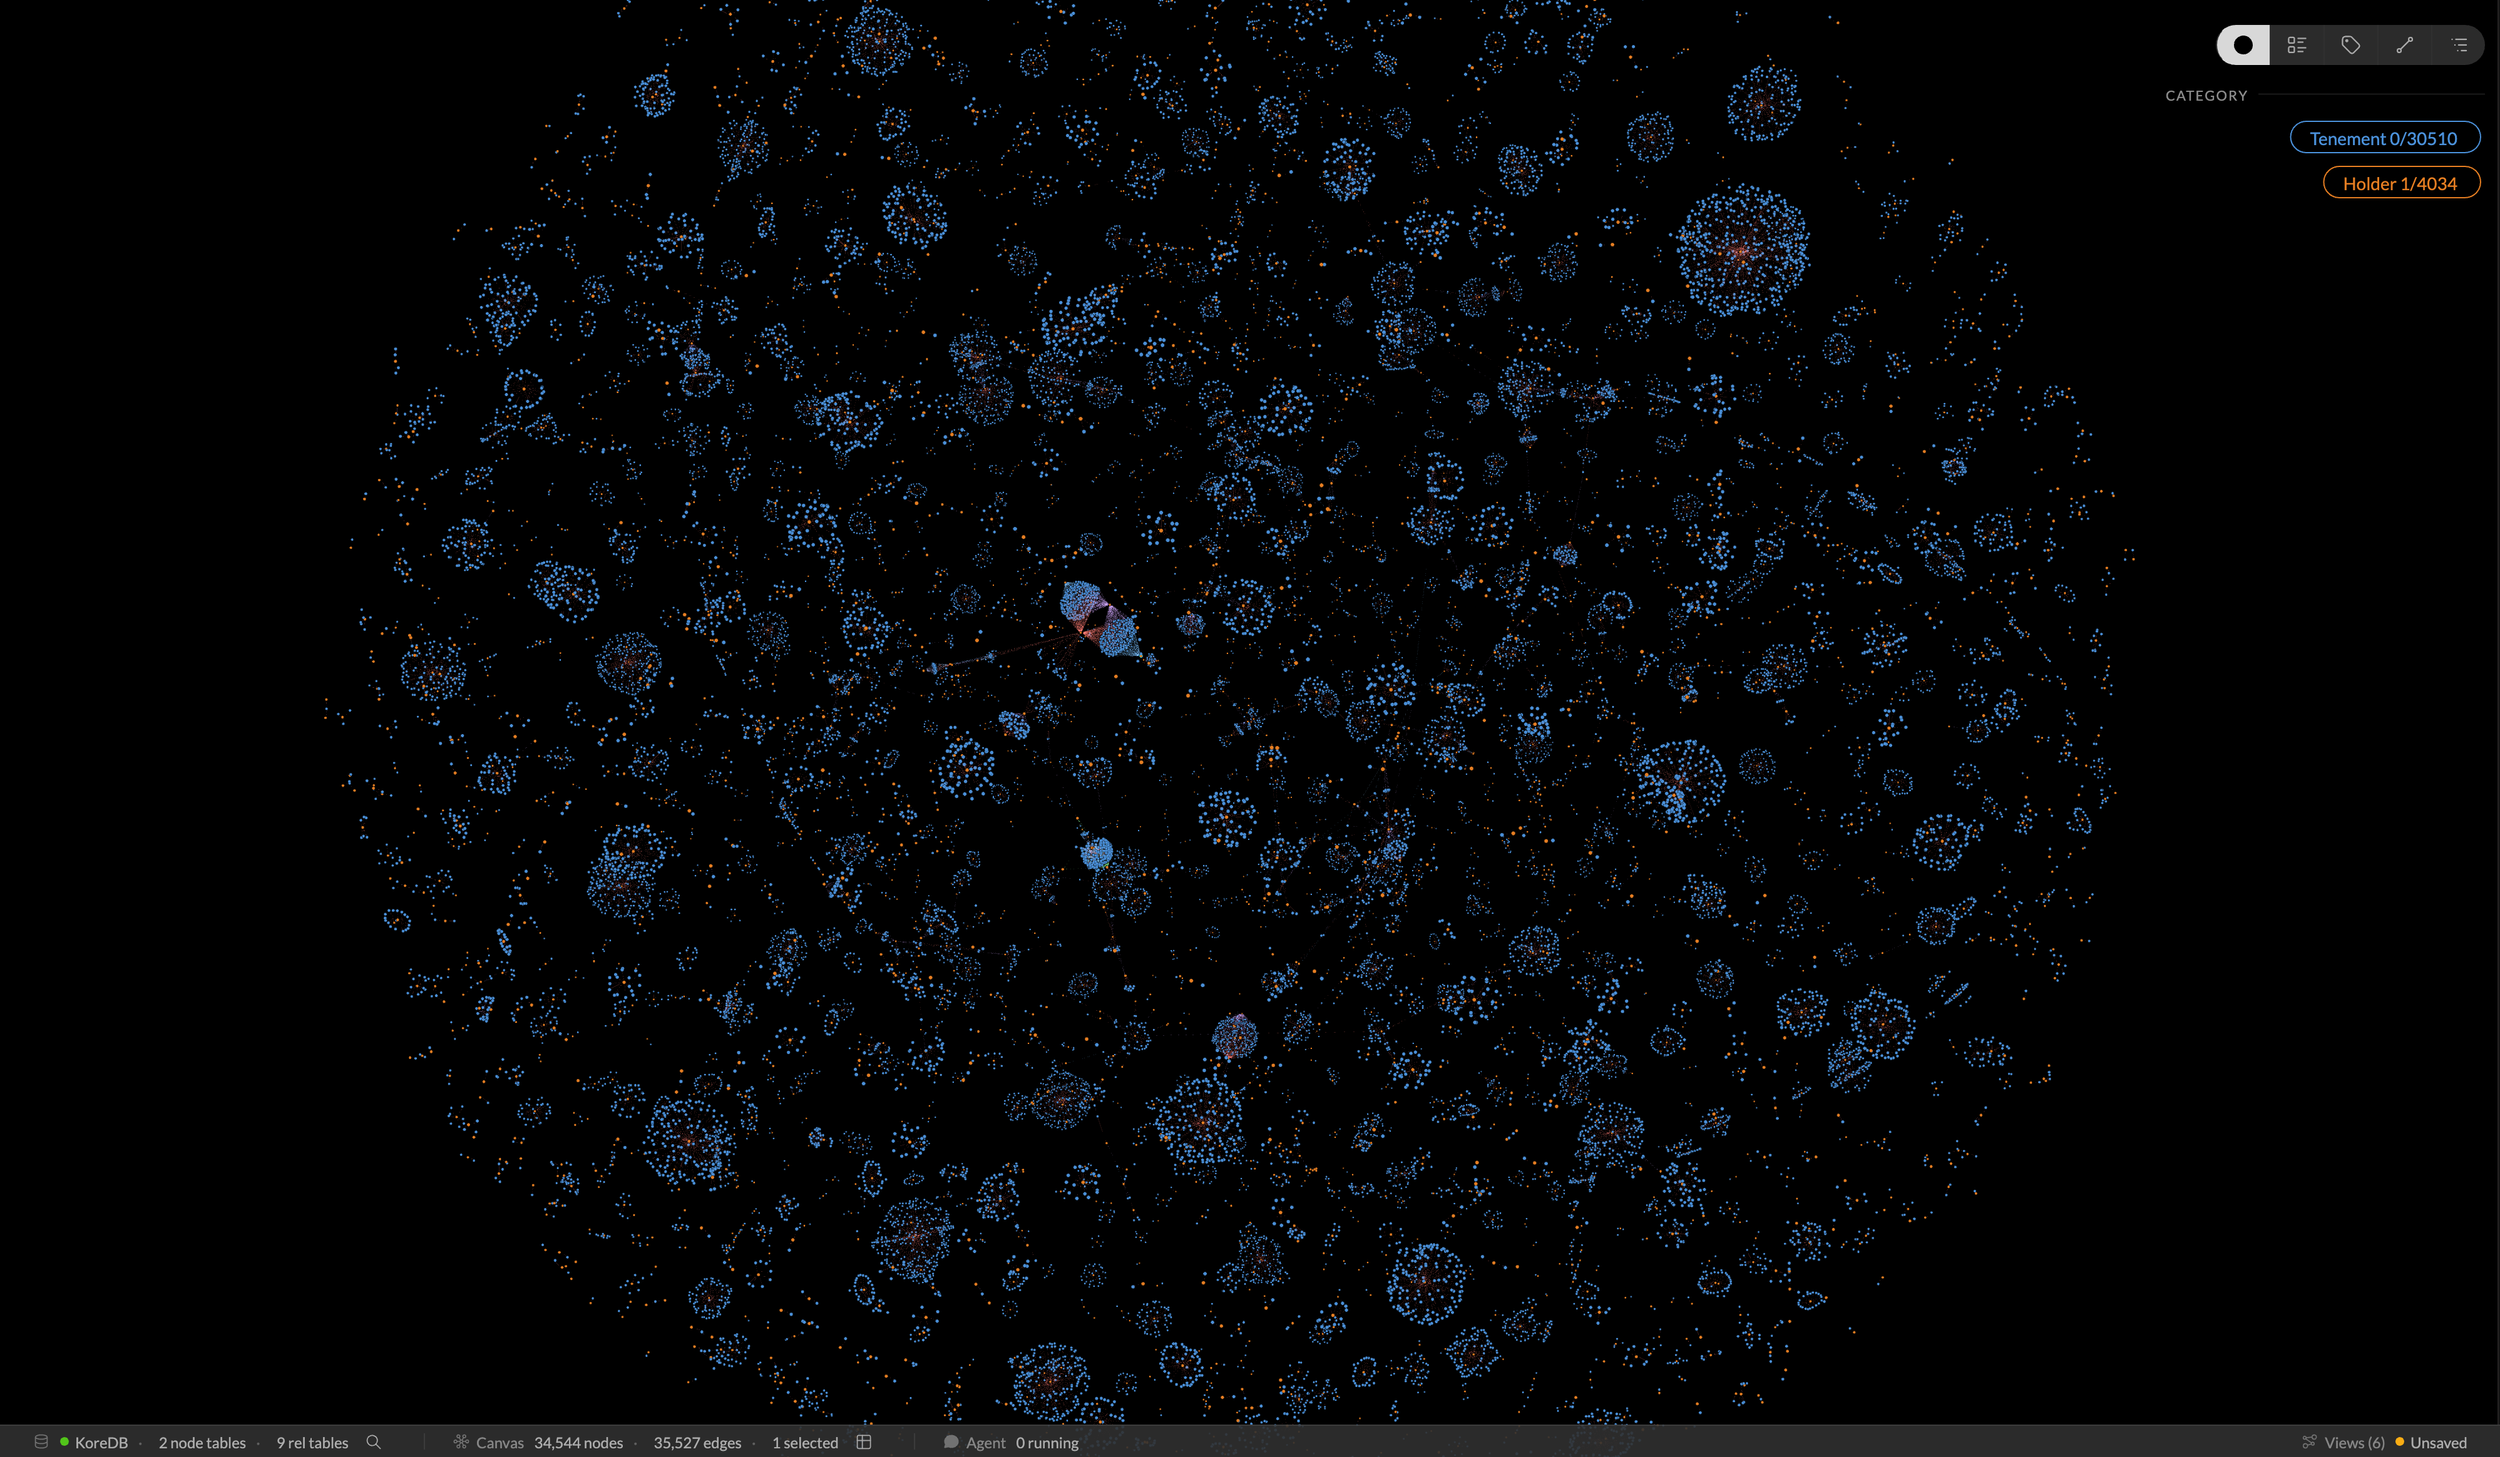
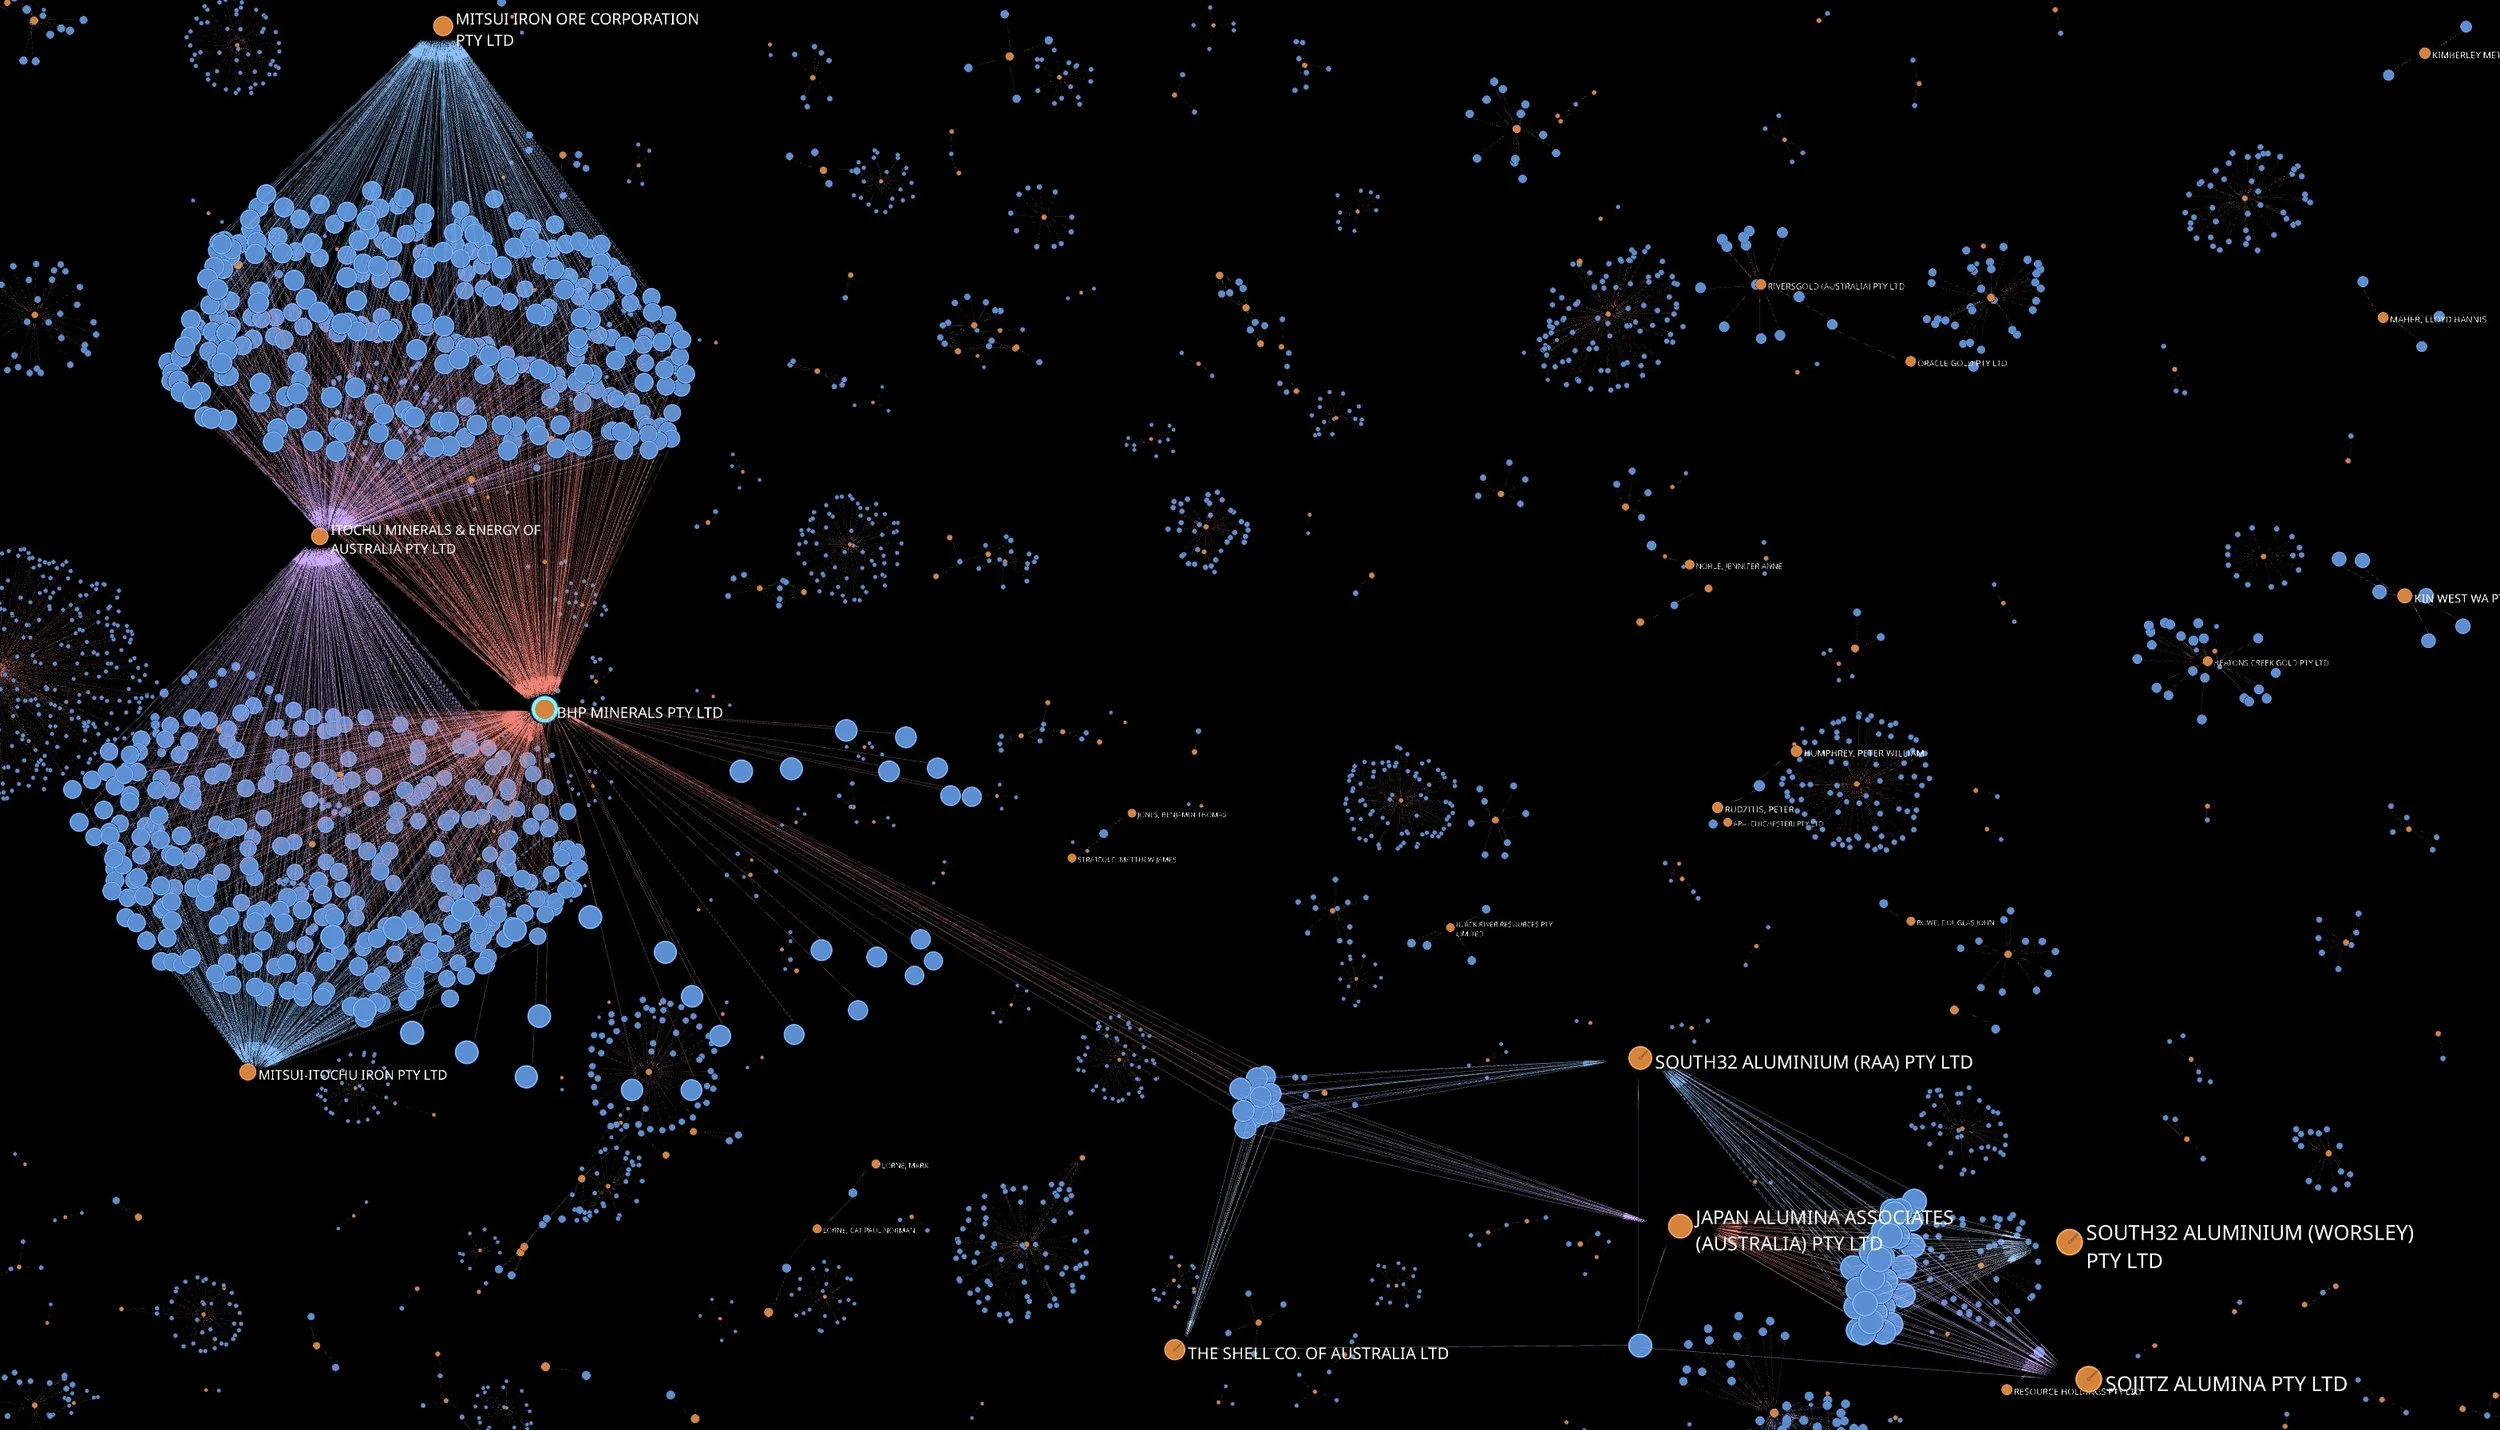
The model below shows what was later affectionately referred to upon it’s public sharing as the “Death Star”. It helped visually answer the question on the structure question and gives us immediate context in terms of volume and complexity.
So if the structure was to reflect a one-to-one relationship we would see model that only had lots of spherical shapes with a tenement holder at its centre and all of the tenements they license sitting around this. You can see from this view that there are indeed many one-to-one relationships but there are also some complex one-to-many relationships in place ( have a look at that great one just just left of centre).
The “Death Star” Tenements Model
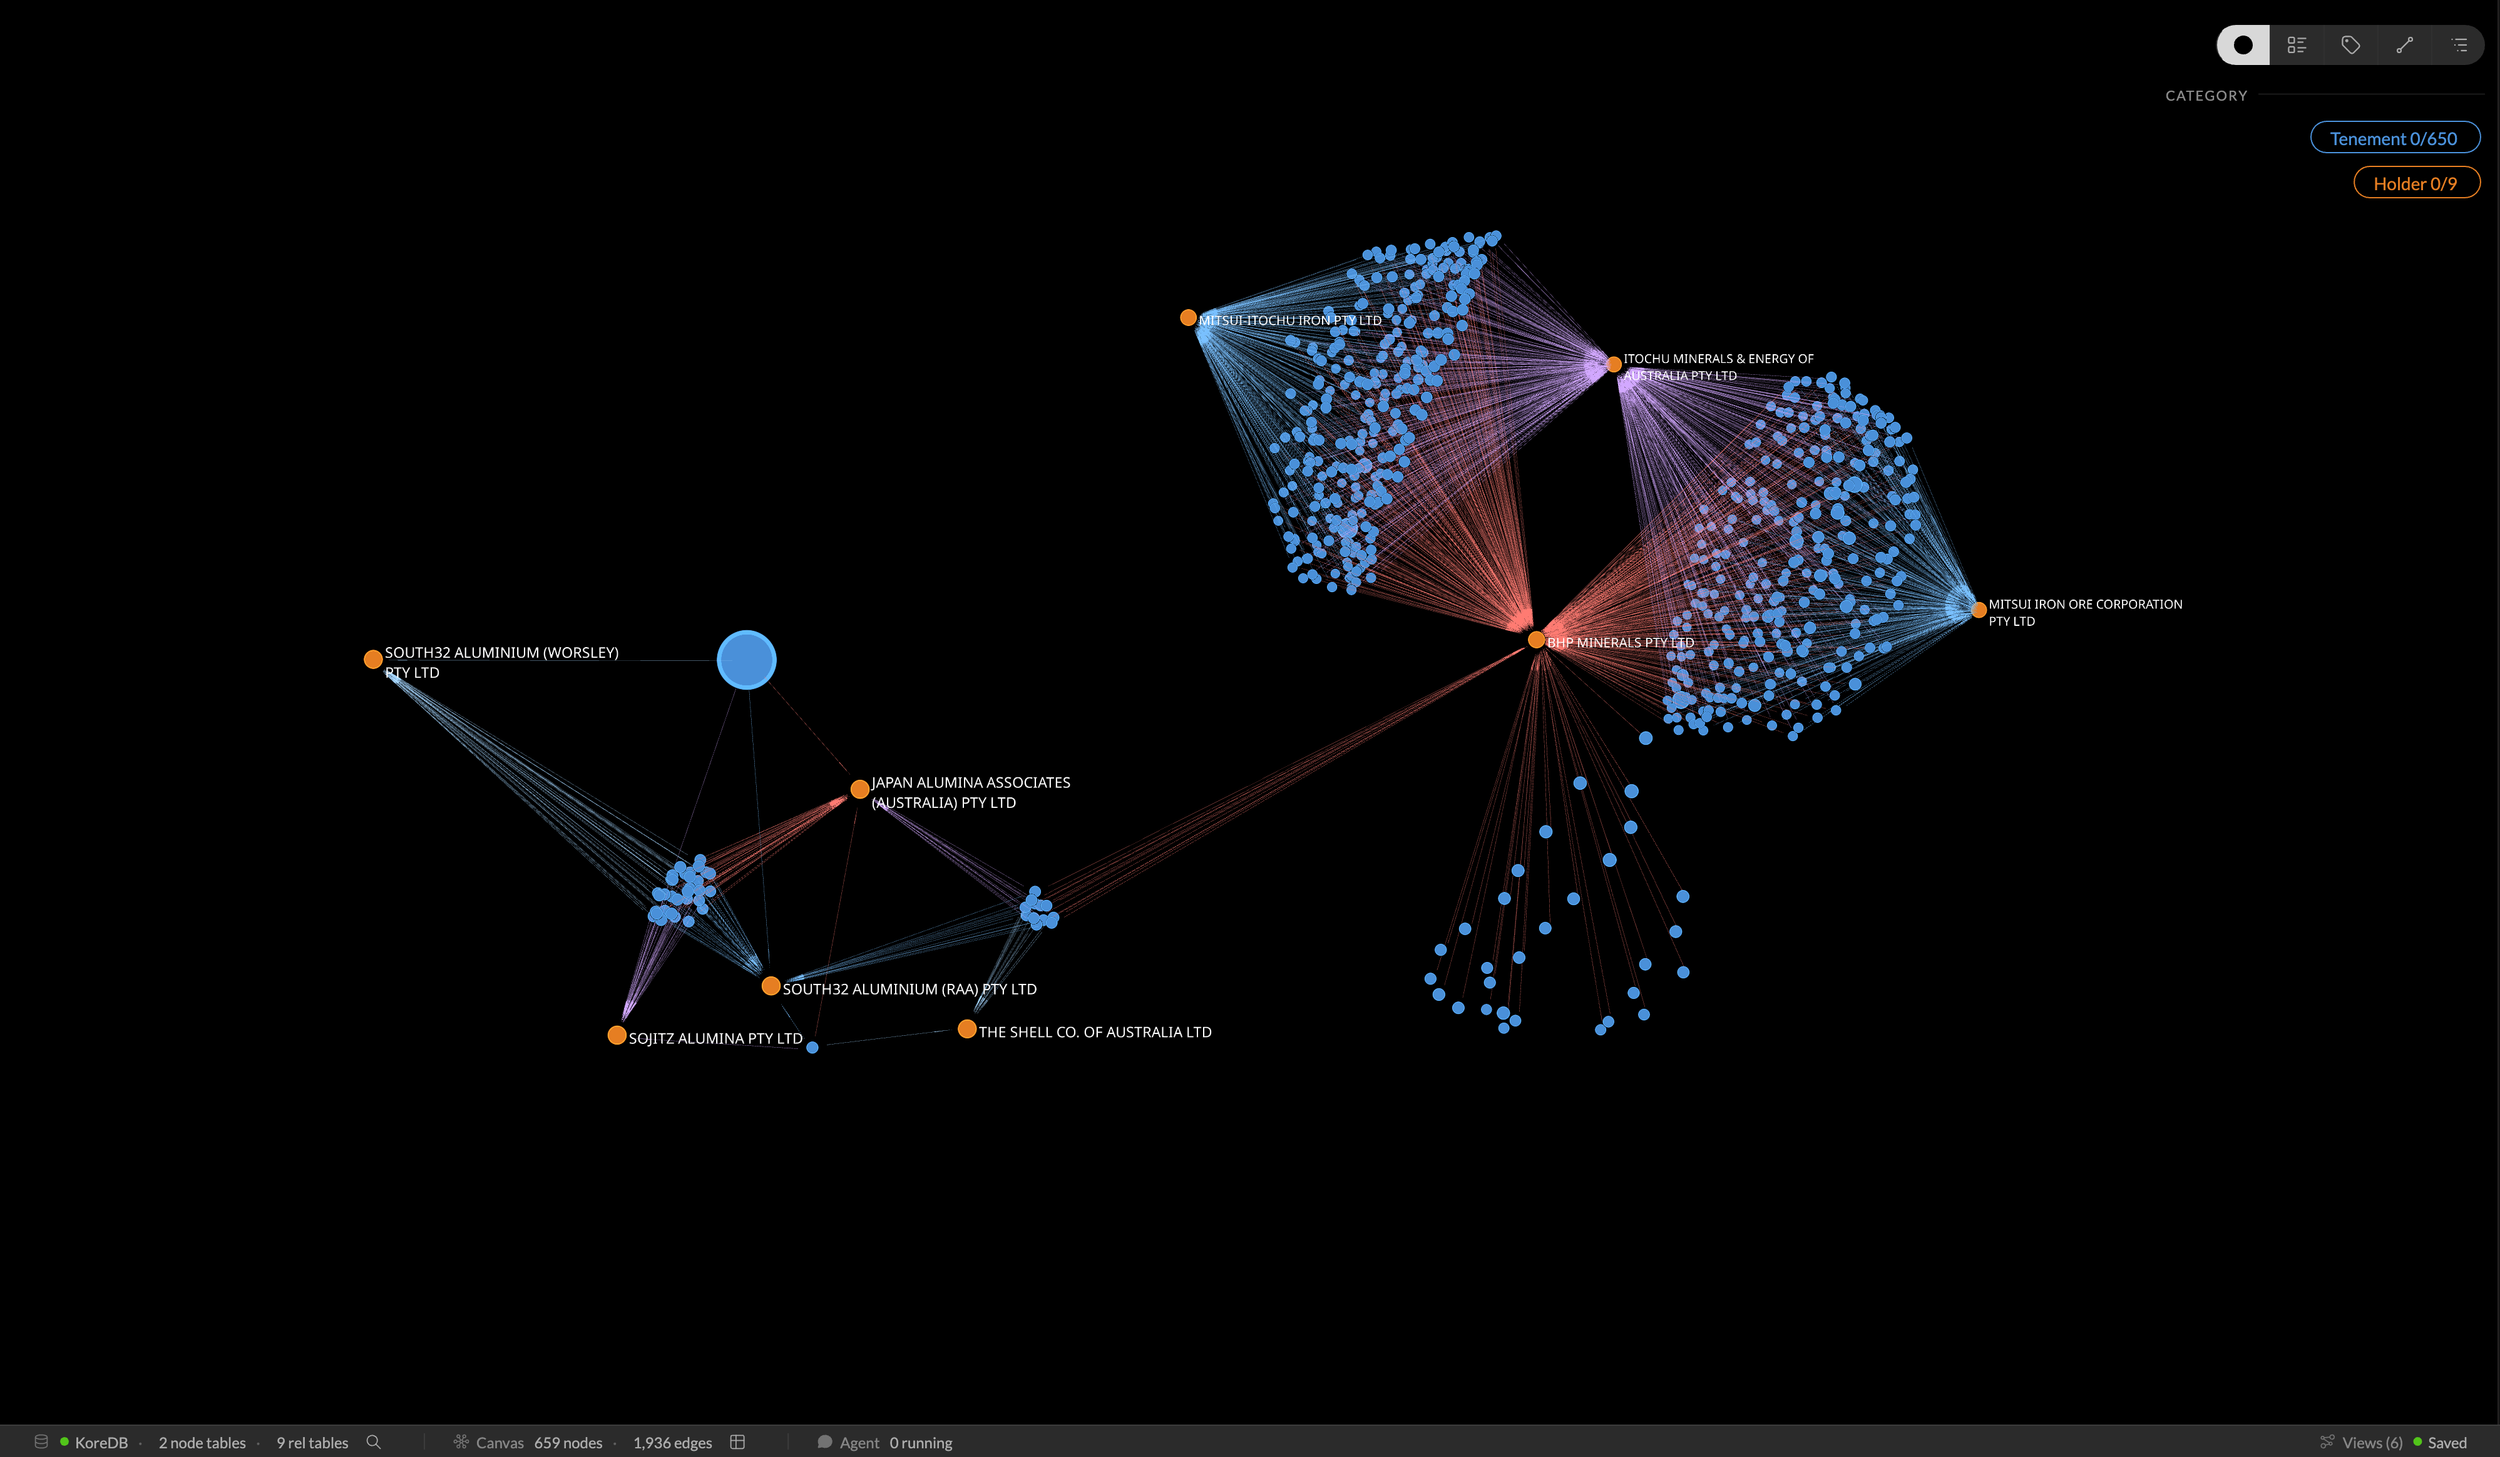
Who’s playing with whom? This is that central cluster filtered down to the connected entities.
It’s a complex interplay of 650 tenements over 9 holders
Whilst this foundational model was a great step in 2021-2022, we now leap forward to today’s offering to show some of things that you and I can now do in the current release that would have required a trained and skilled analyst to do all of this in the background even at the beginning of 2026. This quantum leap is delivered through the introduction of two core additional pieces, an internal graph database (KoreDB), and an interactive agent to assist in the coding and analytics.
I personally was somewhat sceptical when this new offering was first introduced and I didn’t exactly embrace it with any great enthusiasm, but an opportunity arose and we agreed it would be good to trial it to develop and interactive Master Class that users could interact with, we ran this in conjunction with the ACS (Australian Computer Society) in March this year. This all came together well and we had lots of positive feedback so the seed was sown, now there is no looking back and we use it daily as it has become a core part of our go to toolkit.
So back to our tenement model and we start to have a better understanding of the scale and ownership structure, we can now start to explore other data within the dataset. So what about looking at this data set from other perspectives?
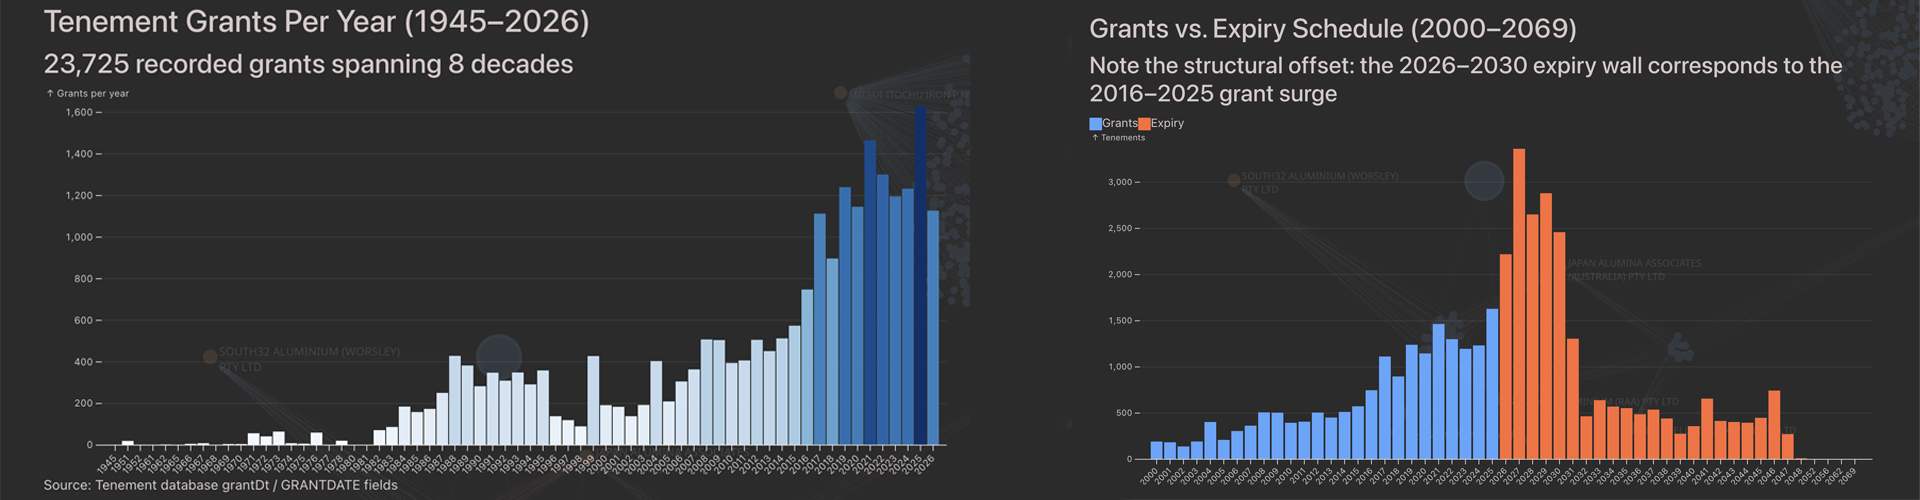
A busy last decade and a very busy renewal period looming…
Both of the above charts were generated through the use of the agent by simply prompting it to analyse the tenement data over time. You can see the rapid increase in tenement licensing over the last decade, but more importantly on the second chart (in orange) we see how many tenements are due to expire in the next few years! I hope DMIRS have visibility of this in their forward resource planning !
We are starting to get a picture and some context on the scale of the tenement management problem but tenements are also linked to physical pieces of land so how can we provide some insights on this aspect. i.e. Where are they located within Western Australia?
The original dataset that we imported from DMIRS had lots of tenement ownership information but did not contain any geo-spatial data so for that we need another data source, and fortunately there was several available for us to explore further.
But before we just plough on, we need to sit back and ask a few questions about where is the best place to store this new geo-spatial data? We could potentialy load it into the internal KoreDB but its a lot of data and realistically what other analytics are we likely to run against this geo-data? For me, it made more sense to extract the geo-data that I needed into a separate external look-up file and query this when geo-spatial information was required. This was both quick and efficient.
Whilst I could have displayed this spatial data within Kineviz, I made the decision to again use the agent to generate this spatial information into a KML file which is a native “Google Earth” file and then use it to display the tenement data. This allows all users to view this data as well as other Google Earth datasets simultaneously. Below we have a selection of mining tenements as well as operational mine data.
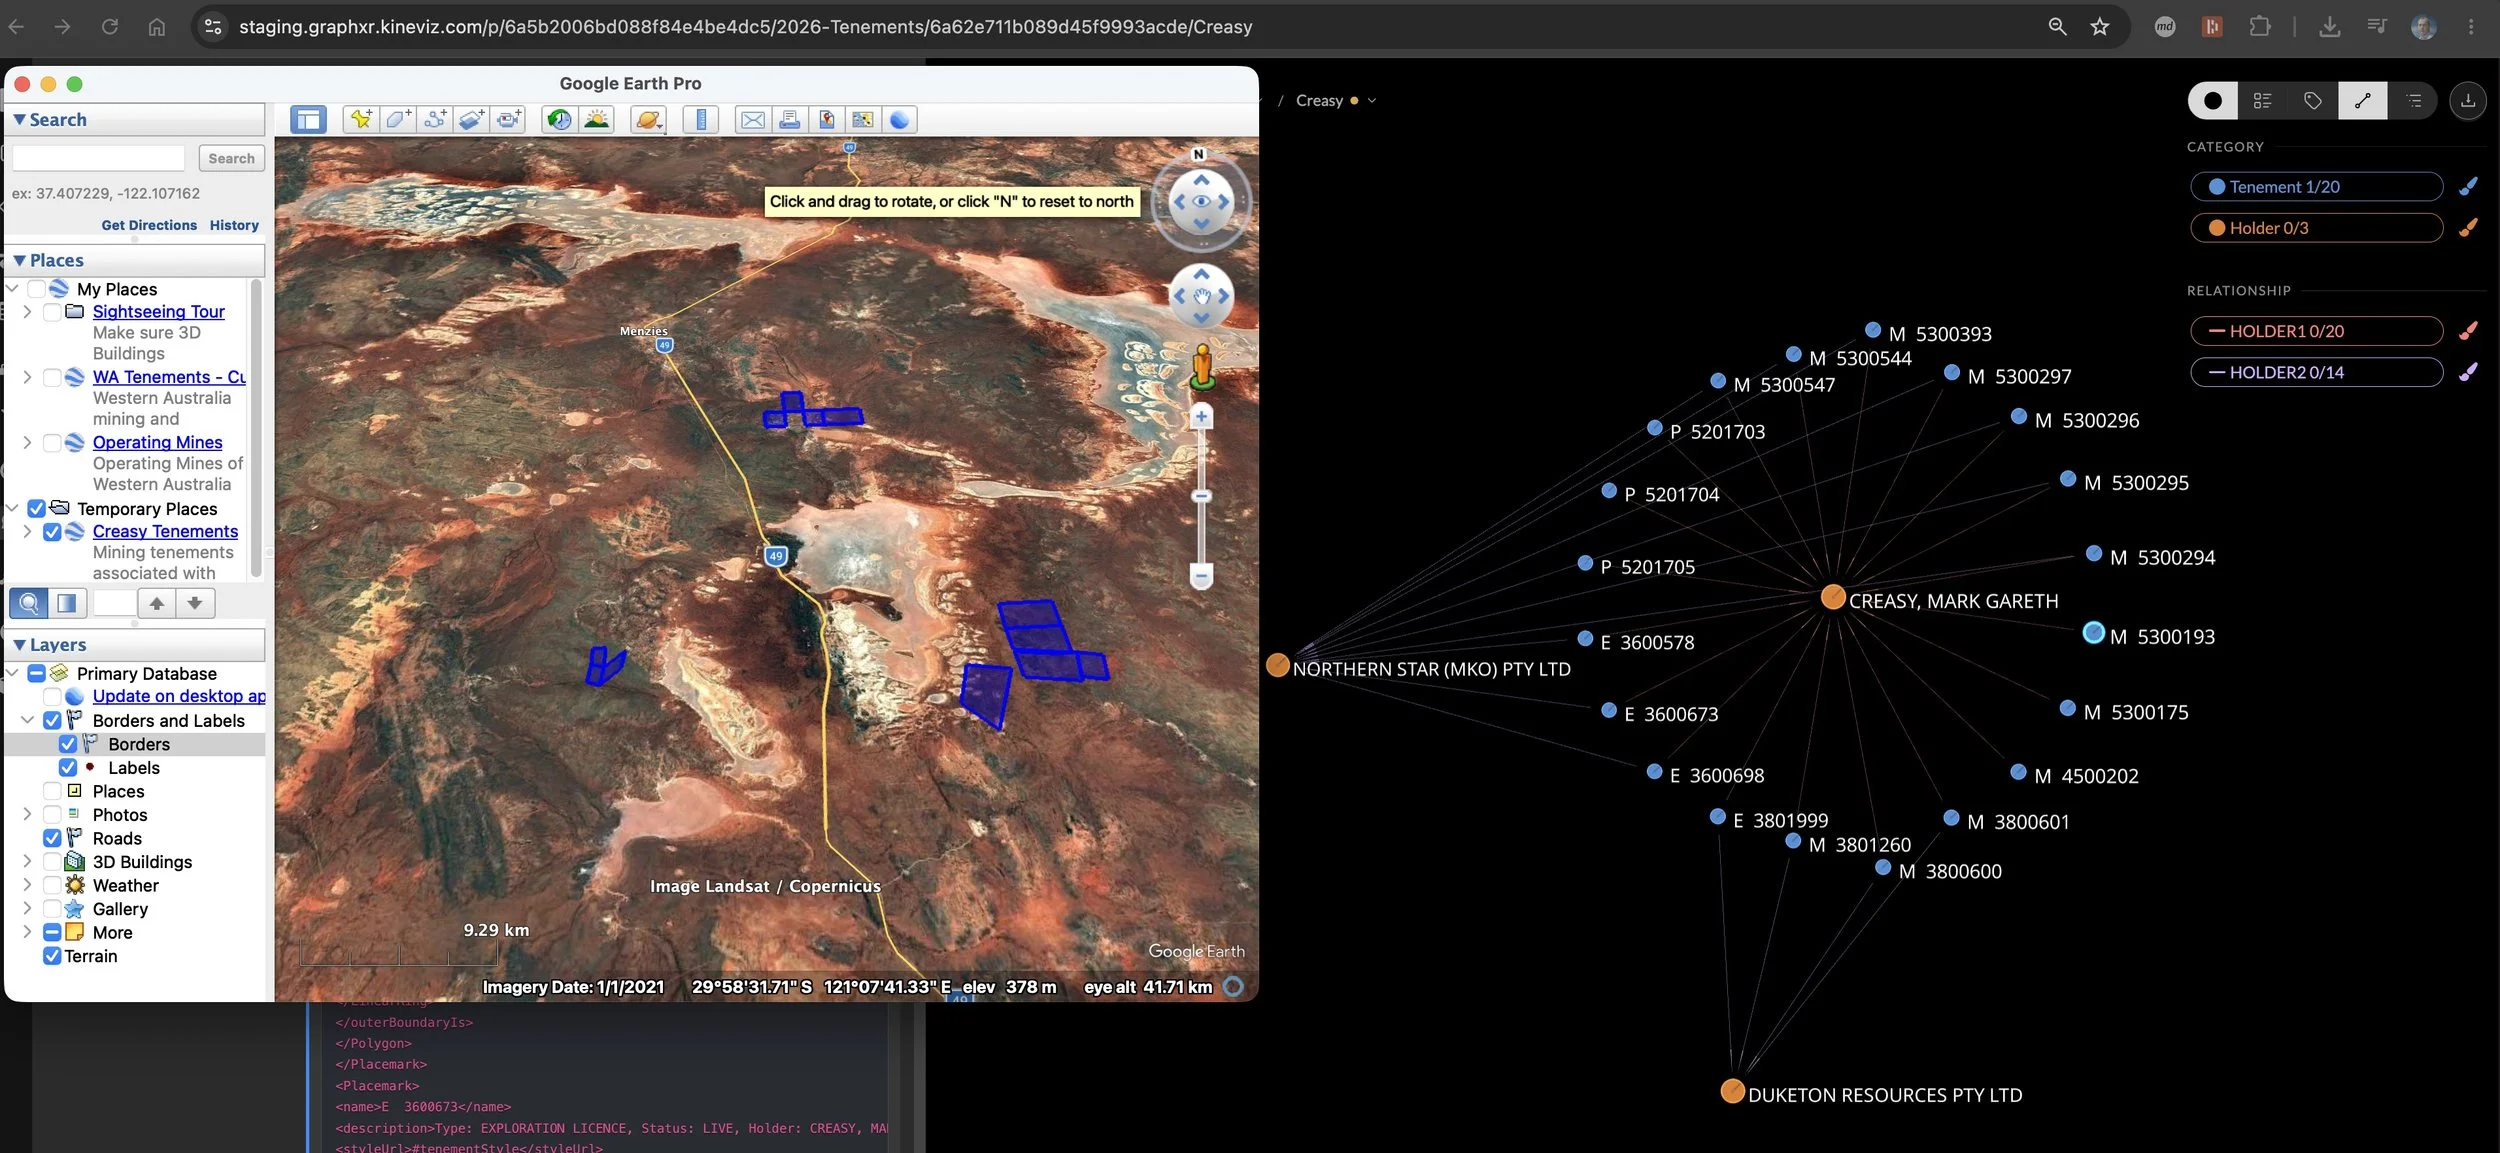
Overlay of Google Earth view on top of the logical Kineviz model
So far so good, but what are we still missing?
The fundamental reason why all of the above is in place is to maximise the discovery and extraction of minerals from these tenements. This resource data is stored in a third dataset that was also available from DMIRS and we used the agent to analyse this data and populate our tenement structures with the mineral records.
So what we can do now with this interactive model?
We can structure any of our questions around ownerships, relationships, tenement status, geolocation or mineral deposits against all tenements across the state and an example extract is shown below.
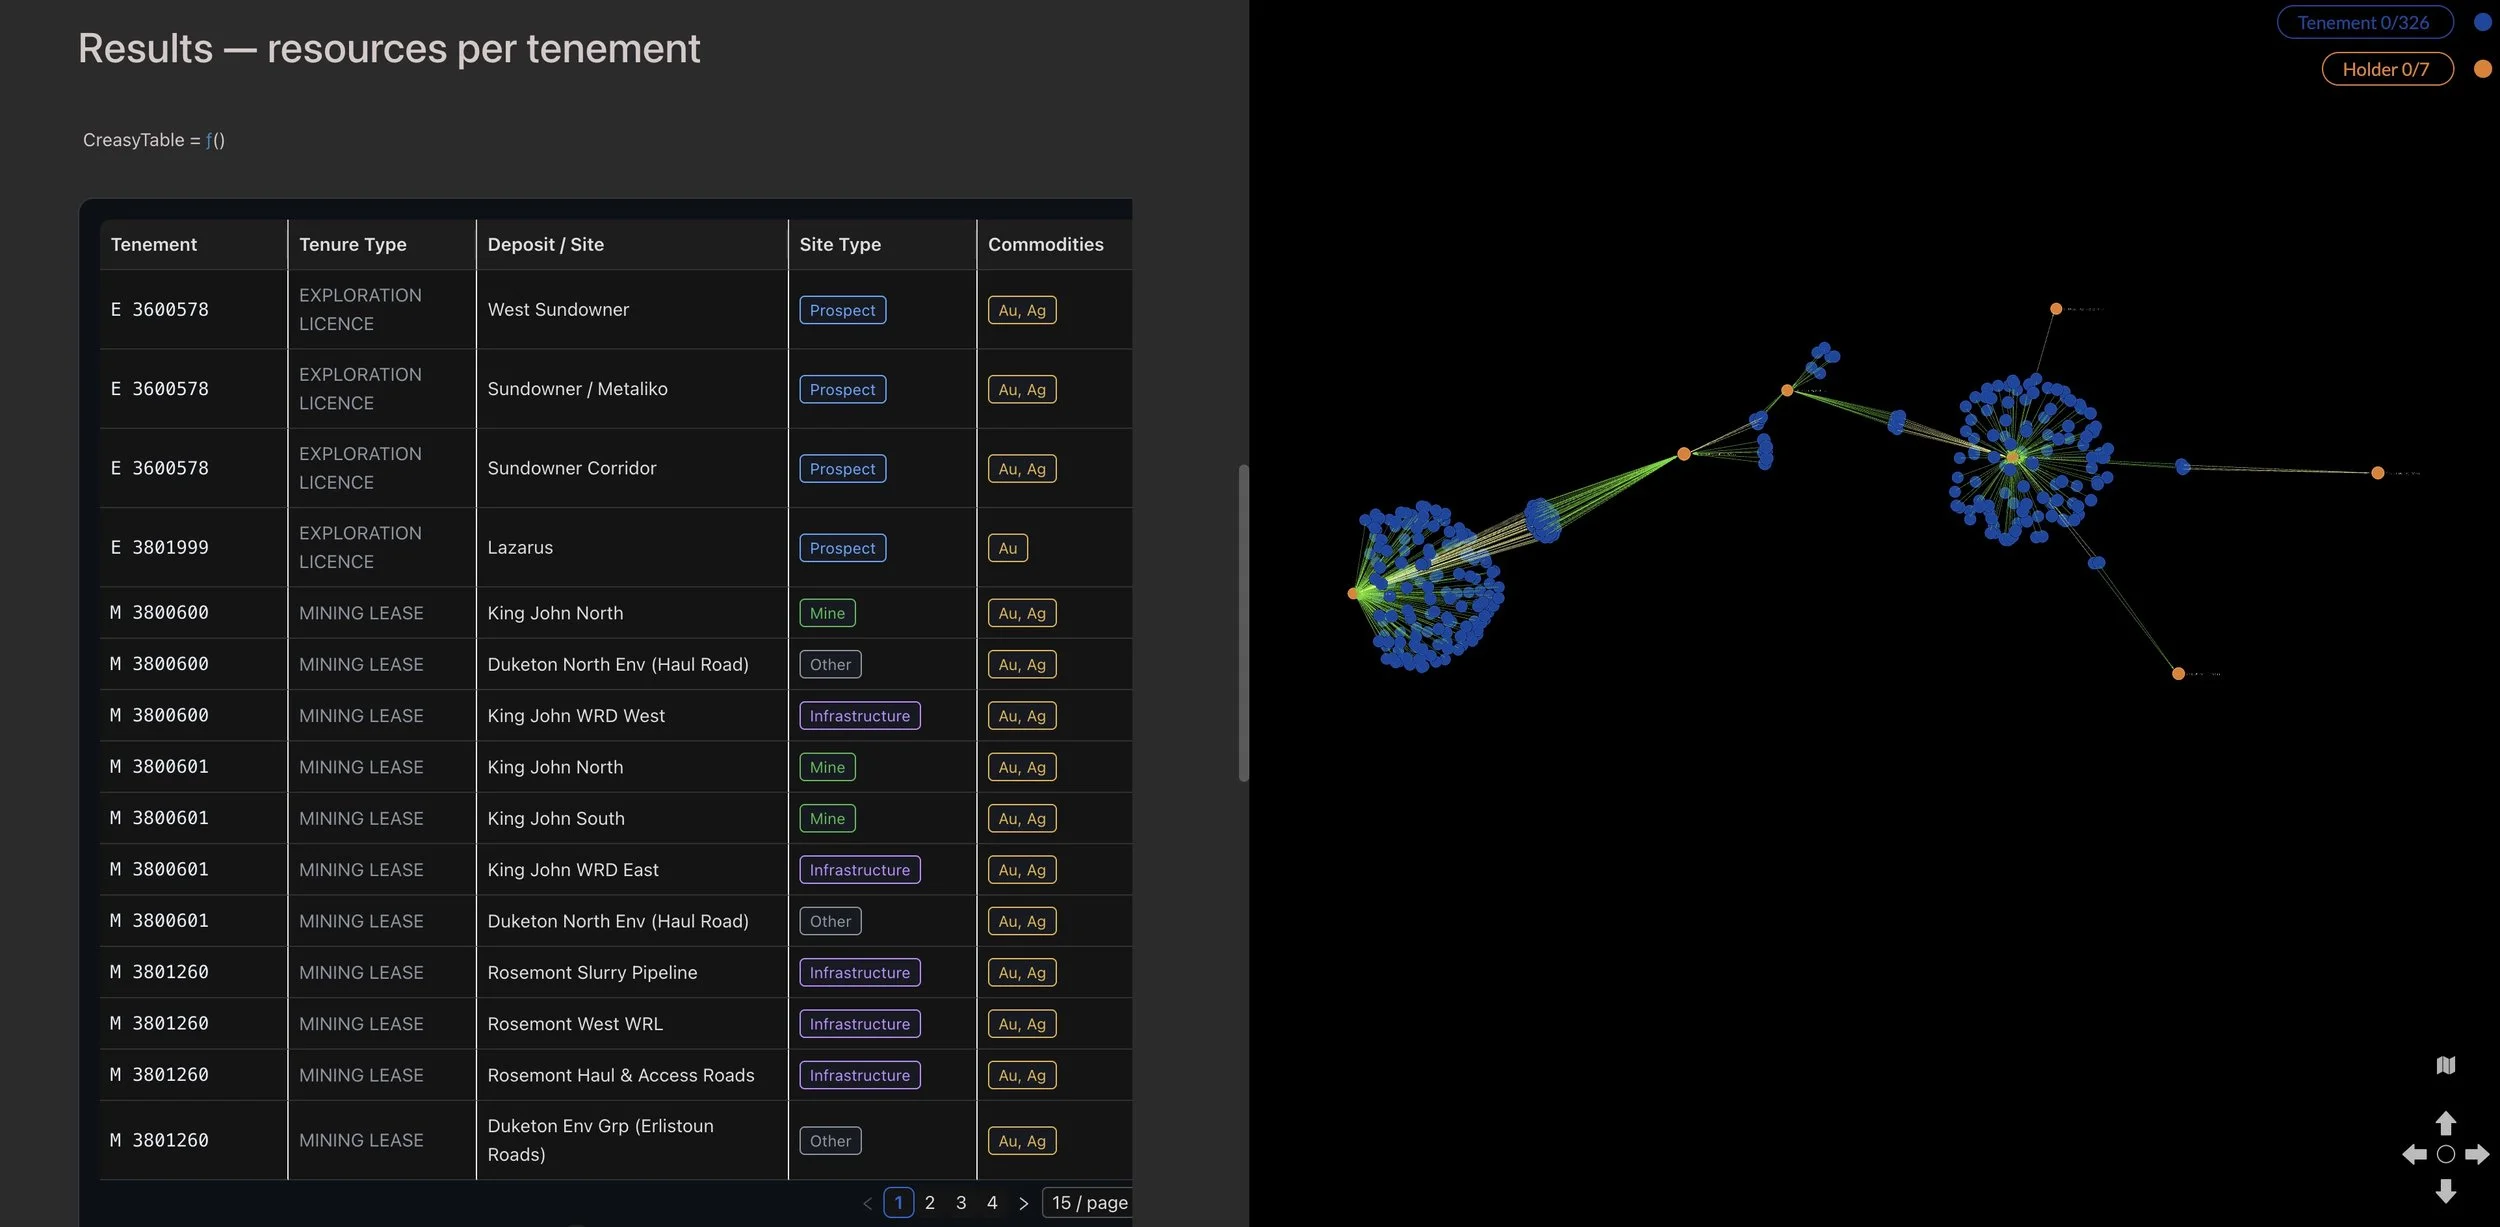
Tenement, Type, Location, Site Type and Commodities
The overlaying of disparate data sets to better understand the relationships and dependencies is incredibly powerful. If you have any questions on any of the above then please feel free to reach out to me.
I hope in the coming weeks to share some additional projects and insights, if you have a project that that you think could benefit from this approach then feel to bounce questions off me.
Thanks to all of the team at Kineviz who have been incredibly supportive (and patient) over the years and are a fantastic group to partner with.
-
Visualising The Social Life of Organisational Data.
The nature of organisational data has shifted from isolated tables within legacy databases and spreadsheets to fluid, highly interconnected networks. Data even has a social life, interacting across multiple organisational functions and relationships simultaneously, and being the core participant within specialised intelligence engines. It represents objects, actors and things. It can even carry value, to denote costs, capacities or metrics. On its journey whether short or long, it influences connections and forms or takes well-worn paths. A lot of this activity remains hidden until we need to know something.
Depending on where it sits and where it flows it can be the centre of attention, it can influence, send signals, play gatekeeper, or simply keep score. We all want to know it, because it can provide the answers to some of our most pressing questions and it can help introduce and develop new relationships and perspectives. Welcome to the social life of organisational data and the role Kineviz graph technology plays in better understanding data, its connections, relationships and social life.
People create graph models for all sorts of reasons, to answer questions, visualise and analyse data, to better understand the relationships between things, or simply to understand the data they have in a particular context. In the Realising-Potential world we use it for all of these things, but most importantly we use them for sense-making, critical thinking and gaining insight. Insights are what are often referred to as those magic aha moments. Sense-making helps us to detect changes in context and determine weak signals that may otherwise be missed.
In our role, we help organisations to structure disparate data sets so a team or leader within an organisation can understand, explore, explain and act with confidence when needed, based on the data, information and knowledge that they have. Being able to analyse the data from multiple perspectives helps to reveal what can otherwise be blindspots, bias, or hidden patterns or observations. Context too can shift as data is added, which means making sure the right context window is in play.
The following model contains data relating to Western Australian Mining Tenement holdings generated from data kindly provided by the Department of Local Government, Industry Regulation and Safety. This model which is fully self-contained, was originally created for building background and context for a particular project we were working on. It has since developed a social life all of its own. The model from which these specific views were created was aptly named “the death star” because of the initial patterns the data formed.
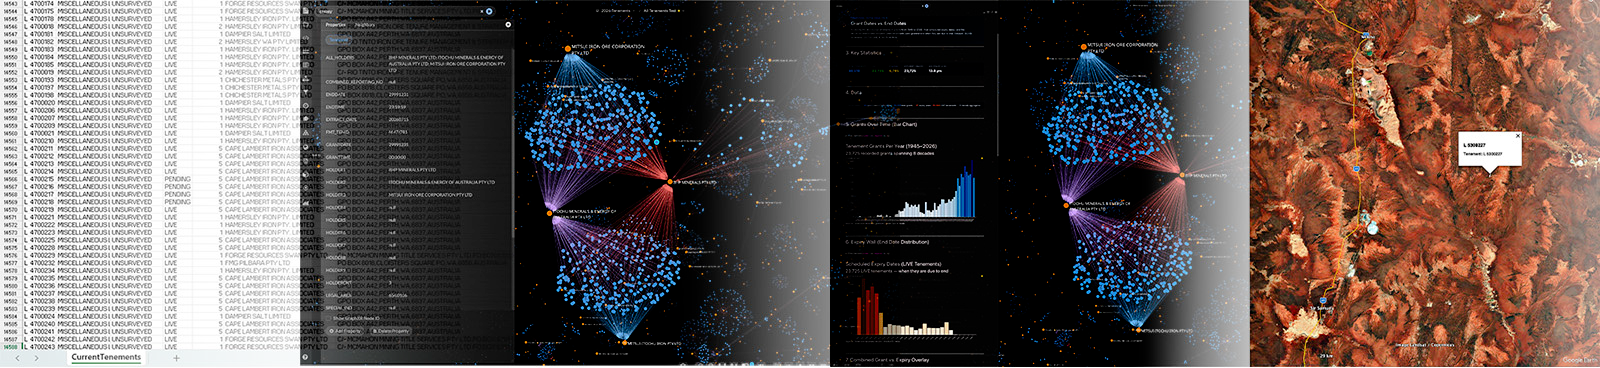
The WA Mining Tenements – CSV → Graph → Analysis
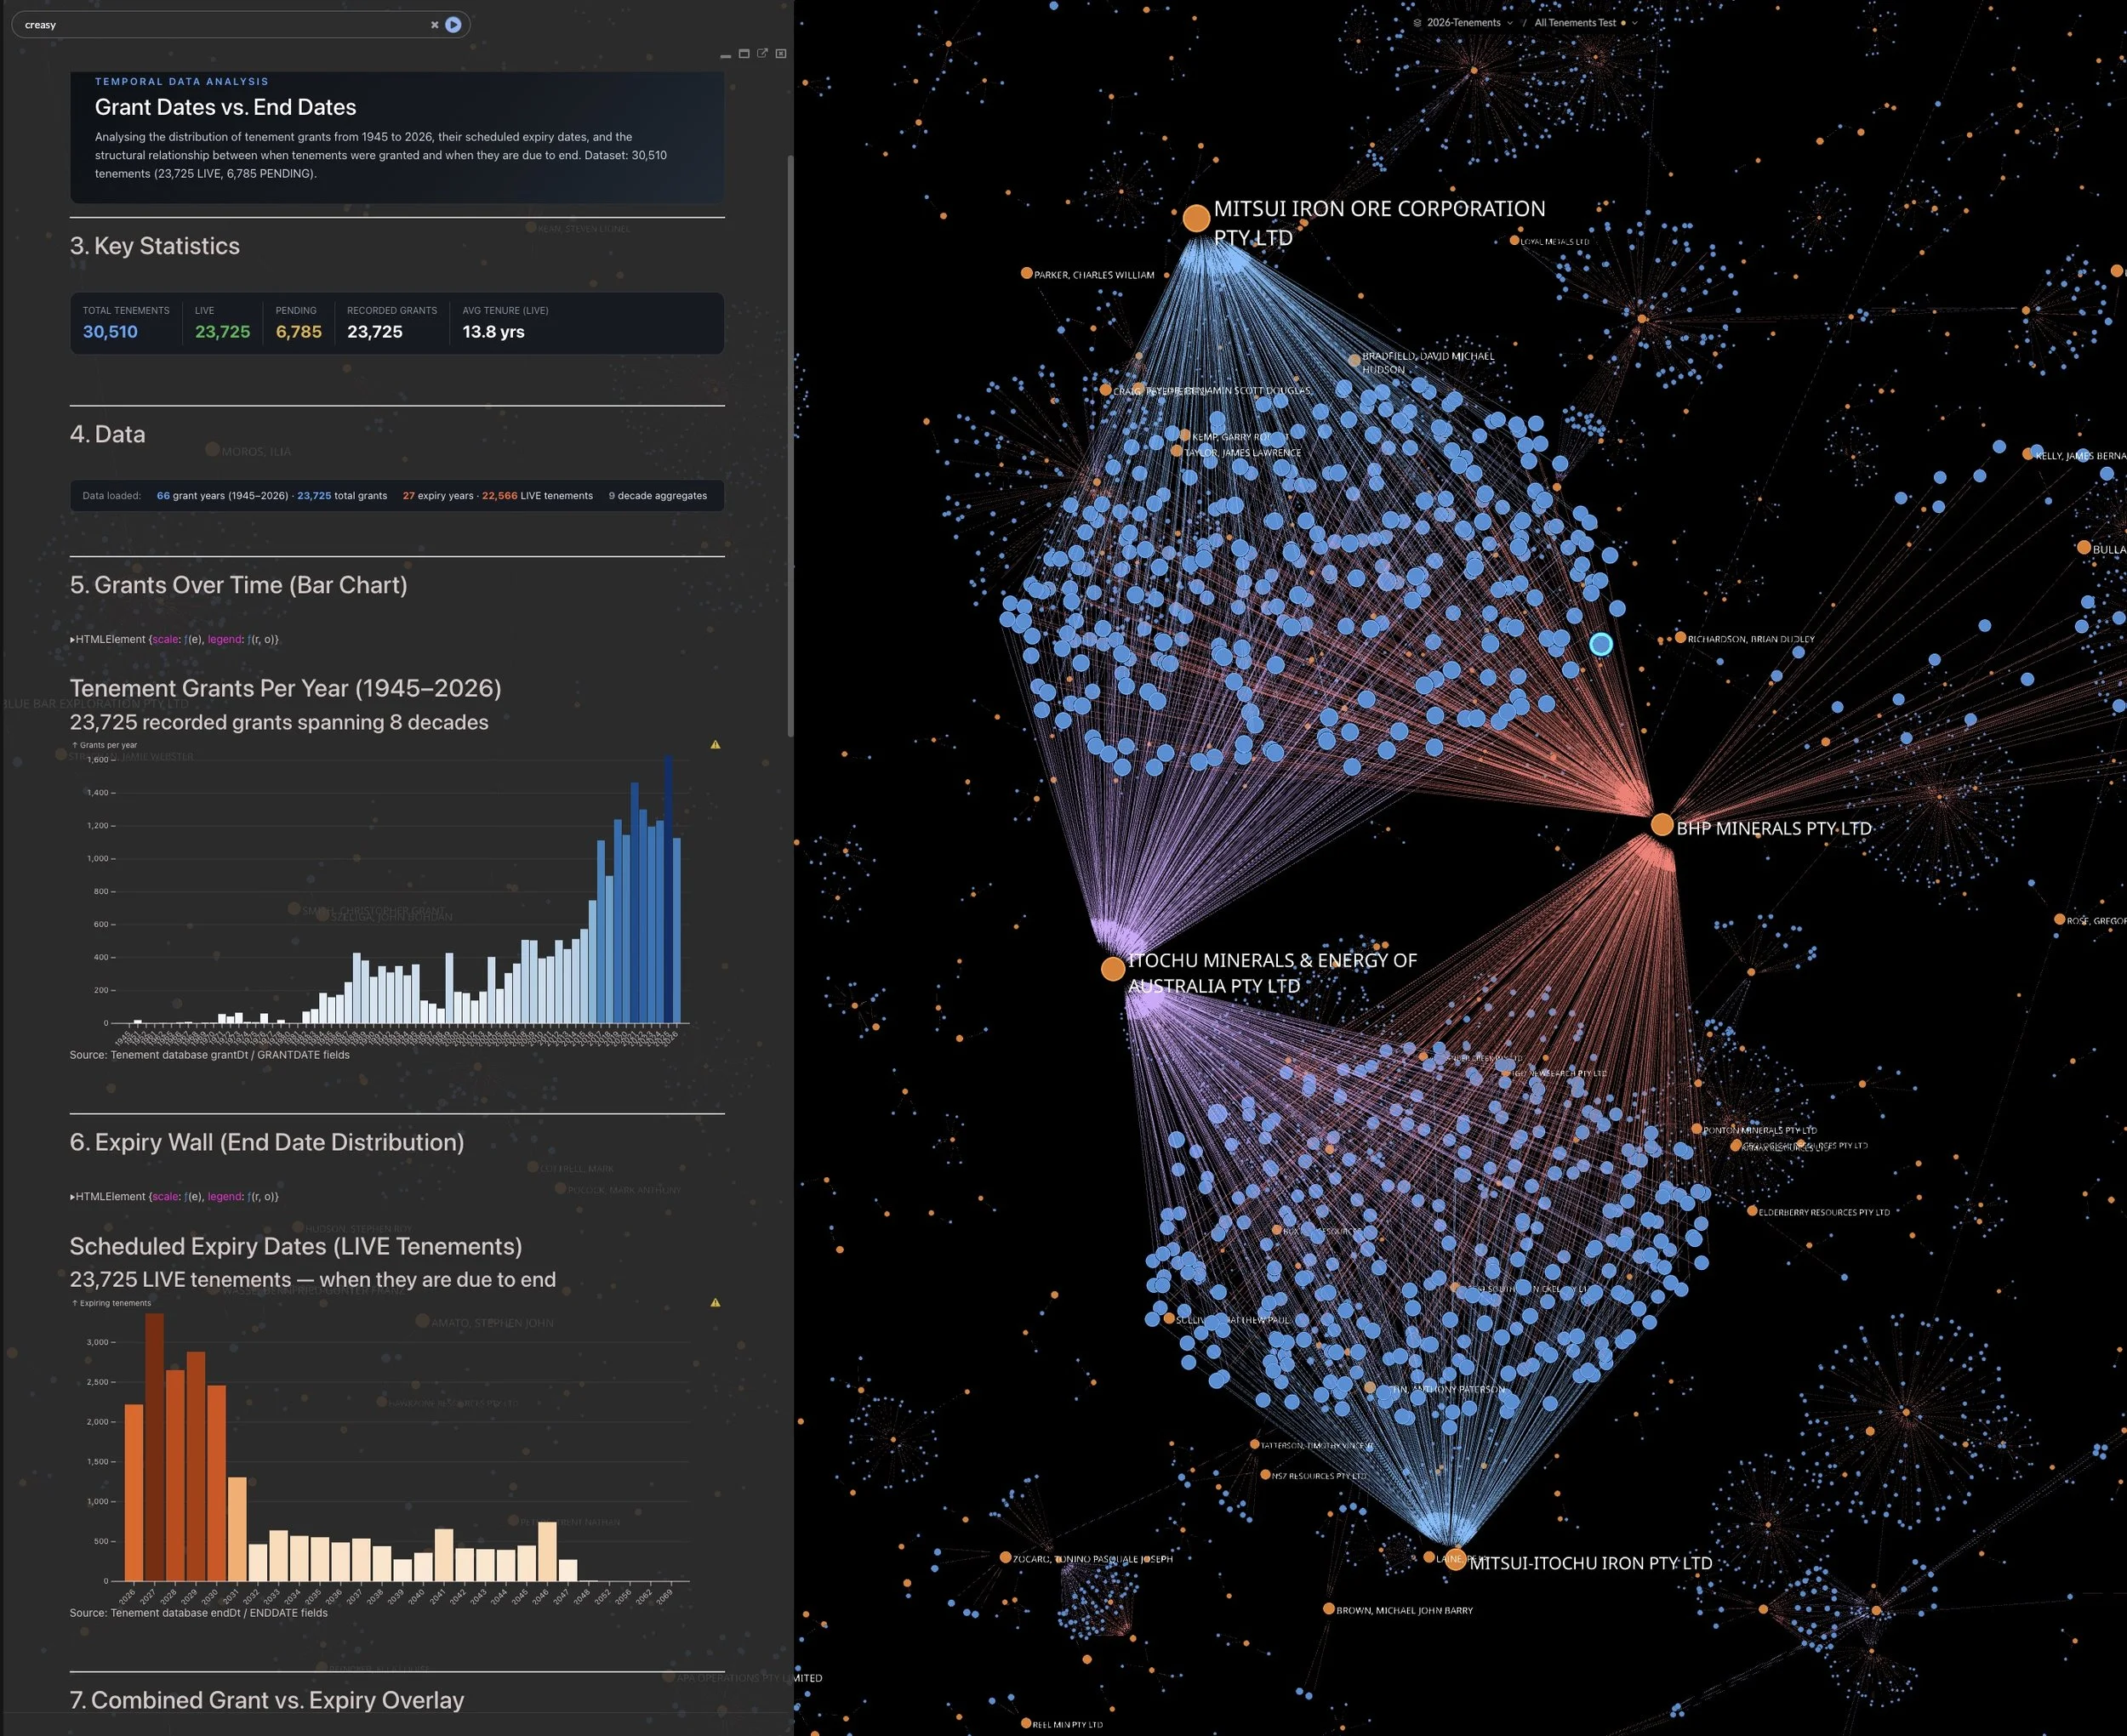
Tenement Co-Ownership
The graph model depicts the complex ownership relationships that are in place whilst the charts summarise the growth in grant licensing and pending expirey dates.
The model shows the complicated interweave of mining licenses, tenement holdings, corporate ownership, and environmental constraints. It makes visible some 30,510 tenements, 4,034 unique holders, and 35,527 tenement/holder relationships. Tabular data was the starting point; we then move to the visualisation of specific structures in this case unique ownership and joint ventures. These views show patterns of tenements, tenement holders, and the extent of relationships and connections. We can start to see the distinction between various entities and the scale, scope, degree and type of activity. Analytics then puts meaning to the data, along with tenement geospatial positioning.
The largest tenement spans approximately 702k hectares. As mining in WA involves a complex mix of mining, law, finance, indigenous communities and regulators, this type of data visibility and analysis is incredibly valuable to the teams and individuals that use it. It improves both effectiveness and efficiency for the teams that need information in context. Instead of cross-referencing numerous spreadsheets, databases and documents, the graph model provides faster time to insight by being able to look at the data from multiple perspectives, at the time we need to know it.
In this one model alone, there are in excess of sixteen perspectives that can be navigated and explored. By being able to interact with the data in this way, stakeholders can easily navigate the complexity of the world of mining tenements. Stakeholders such as Native Title and Heritage groups can determine what types of approvals are needed or have been granted, and gain understanding of the extent and impact of mining activity on native title lands. Mining organisations can see tenement changes, holdings, opportunity, and risk, ensuring that tenement related data supports their mining plans and critical relationships.
Corporate Merger & Acquisition team activities realise value through the identification of ‘tenement blockages’ instances where a ‘strategic land holding’ opportunity arises as a tenement license owned by another party may be about to expire resulting in an acquisition opportunity. Corporate owners may simply want to know what fragmented holdings they own to enable tenement holding consolidation.
The context window can increase as data is added and the models increase in size. With this level and type of visibility both Regulators and Miners can better assess the cumulative impact of mining and its impact on ownership, revenue generation, licenses, state revenue and the environment. Models such as this can be used as computational sensors, making the who, what, where, when, how, clearer.
Data originally entered into a spreadsheet as a numerous series of rows and columns and being somewhat difficult to fathom is now through the use of graph technology, exposing hidden patterns and relationships that were previously difficult to see. It adds value to the data by putting it into context without breaking data integrity.

Merger & Acquisition – CSV → Graph → Analytics
The M&A View
Maintaining data integrity and provenance is important to ensure information is reliable and trustworthy across its entire social life and lifecycle. The model below was created for sense-making and critical thinking surrounding a particular acquisition decision that was to be made. The decision once made would be irreversible and therefore high stakes.
The targeted businesses industry was well known to the acquisition team, but the target organisation was not. The acquisition team had access to due-diligence information, mainly text based documents, system generated reports and spreadsheets. It was difficult for them to put the organisational picture together from the information they had and in a tight timeframe. We took the data available, analysed it and visualised it so the organisational structure, relationships and the various interplays could be considered.
The result is the model below which shows the organisational structure, activity, and resourcing of what can be considered a complex organisation, comprising multiple locations and thousands of people.
It was only when the data was put into a graph model that the relevant parts of the ‘context and understanding’ puzzle could be put into place, enabling the team to better understand and navigate the data in a meaningful way. Visualising and analysing the data raised the level of ‘acquisition intelligence’ as it allowed the various acquisition specialists to sense-make, critically test scenarios and reason together. They needed to understand and have transparency of the organisation and its many moving parts, what was and what was not possible. However, before they could get to that point, we needed to determine what was defined or encoded within the data, elements such as roles, locations, reporting lines, cost centres, payroll awards etc. The approach we took was to visualise the data in such a way that it was a central part of the reasoning and questioning process rather than treating it simply as the answer to a data assessment problem.
The model clearly depicted the big picture, and most importantly it helped to provide a view of the organisational dynamics. The analysis allowed exploration of ratios (number of managers and employees), and the formal dynamics, but more importantly, it highlighted the location, team, and individual connections, relationships and contribution. It provided a method to determine the type and levels of interaction between the various operating locations, something that was difficult to determine prior to visualising the data. It also started to highlight where vulnerability and risk existed and identified risks that were not on formal risk registers.
Many things shape vulnerability and risk in a merger and acquisition. It can take many forms and sometimes it is easy to see and understand, and at others less so. Vulnerability in this context can be defined as a potential weakness, a flaw or shortcoming that can exist in a process, a relationship, or at the broader system level. A risk on the other hand is the potential for loss. Being able to analyse the data from multiple perspectives and ask specific questions made vulnerability and risk clearer, allowing the team to better assess probability and question whether it mattered.
Why Graph and Why Now?
As can be seen by the models we have used here, graph technology brings the data to life. Immediately patterns become obvious, specific elements take our attention, and we can quickly distil things of interest. The model allows the user to interact with the data, to analyse it, navigate relationships, challenge and question. It provides a vehicle for sense-making and critical thinking; it allows the user to understand the data relationally in a single connected view.
When data is visualised and abstracted, it allows knowledge to be created and shared and for insights to emerge, some obvious, some non-obvious. Insights are the things that are discovered by looking at things differently, simply by taking data, asking questions, clarifying, and understanding.
In a world of increasing data volumes, we need ways to better access it, make sense of it and use it to create and share knowledge. Our experience has been that graph models are an effective method of realising the potential of organisational data and building capability through knowledge.
The combination of graph and AI technologies makes for a powerful toolset. Combined, they open up a world of problem-solving opportunity and capability for every business.
-
Why Enterprise Architecture 4.0 combined with Kineviz GraphXR + System Logs are a Leap Forward
We are experiencing a paradigm shift that aligns Enterprise Architecture with the needs of digital and AI enabled organisations. That alignment is achieved through Enterprise Architecture 4.0 and the use of Graph technologies. In an increasingly digital business, Enterprise Architecture practices needs to be about more than abstract models showing coloured boxes and lines. It is about businesses being able to see and understand the organisation as a living, active network of people, processes, systems, relationships, governance and data.
Combining GraphXR with Enterprise Architecture 4.0 enables architects to move from hierarchical or abstract type views to a more connected, interactive, connected and transactional representation of the organisation. There are several practical and economic reasons why this combination works. We can derive deep insights into how processes are actually executed, as opposed to how they are thought to work based on process models. Variations and deviations can be quickly determined, as can non-optimal workflow paths. Actual activity times can be analysed to improve productivity, time to complete and operational cost.
Enterprise Architecture 4.0 embraces all things digital and provides a framework for Artificial Intelligence, Living Architecture Models, and Digital Twin. The strengths of GraphXR means it can process and analyse large volumes of complex data, visualising the data and mirroring how complex systems actually behave. This enables the user to see operational patterns, anomalies, and key connections in context.
GraphXR is a powerful data analytics and visualisation platform and for this case study we analysed and visualised XES (eXtensible Event Stream) Event Logs, created by most enterprise resource planning systems (ERP) to expose how systems are used within the organisation. An XES file is a structured event log that uses an XML format to store events. The non-linear, dynamic and deeply intertwined world of the businesses data comes to life once analysed and visualised.
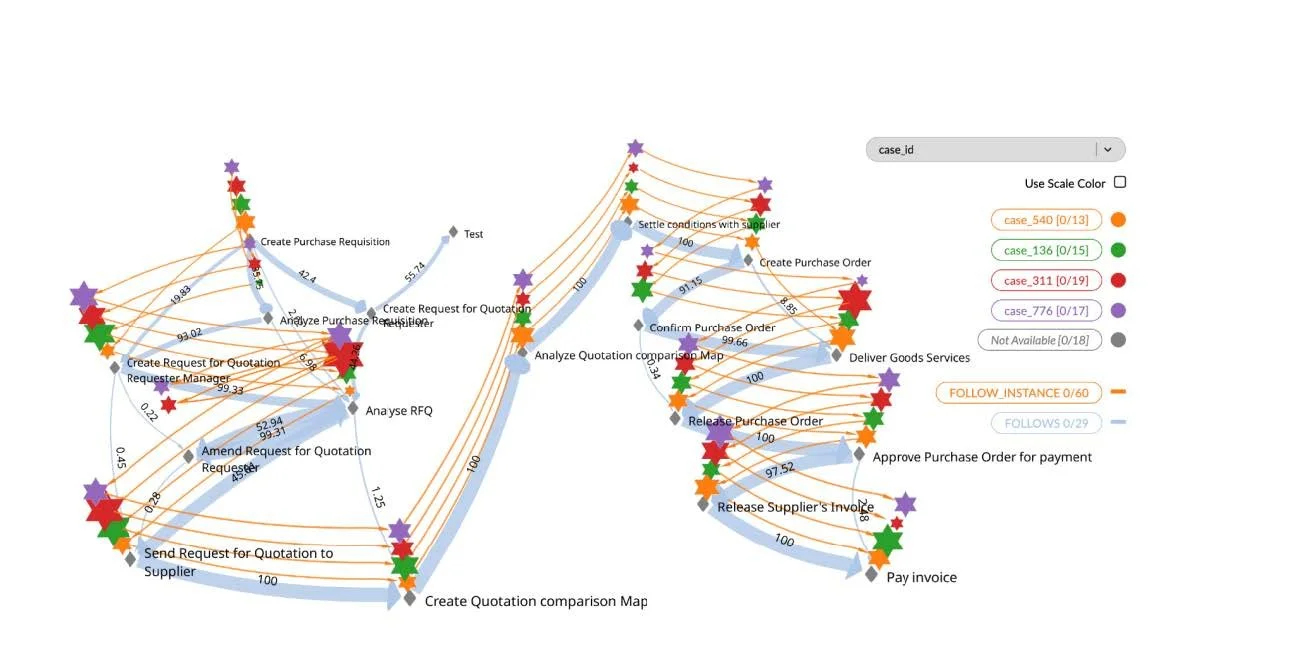
In the following example the source data was an XES file from an Enterprise Resource Planning System (ERP). From the file content we were able to discover the process flow from 900 cases and 22,000 records. A case is represented in the graph as a workflow path. Each Node within the graph depicts an activity or event and the Edge (the link between Nodes) shows the transition or sequence. The benefit of using GraphXR over more traditional process mining tools is it clearly shows the extent of the relational complexity and has the added benefit of bringing together structured and potentially additional unstructured data into the analysis, something typical process-mining applications don’t offer.
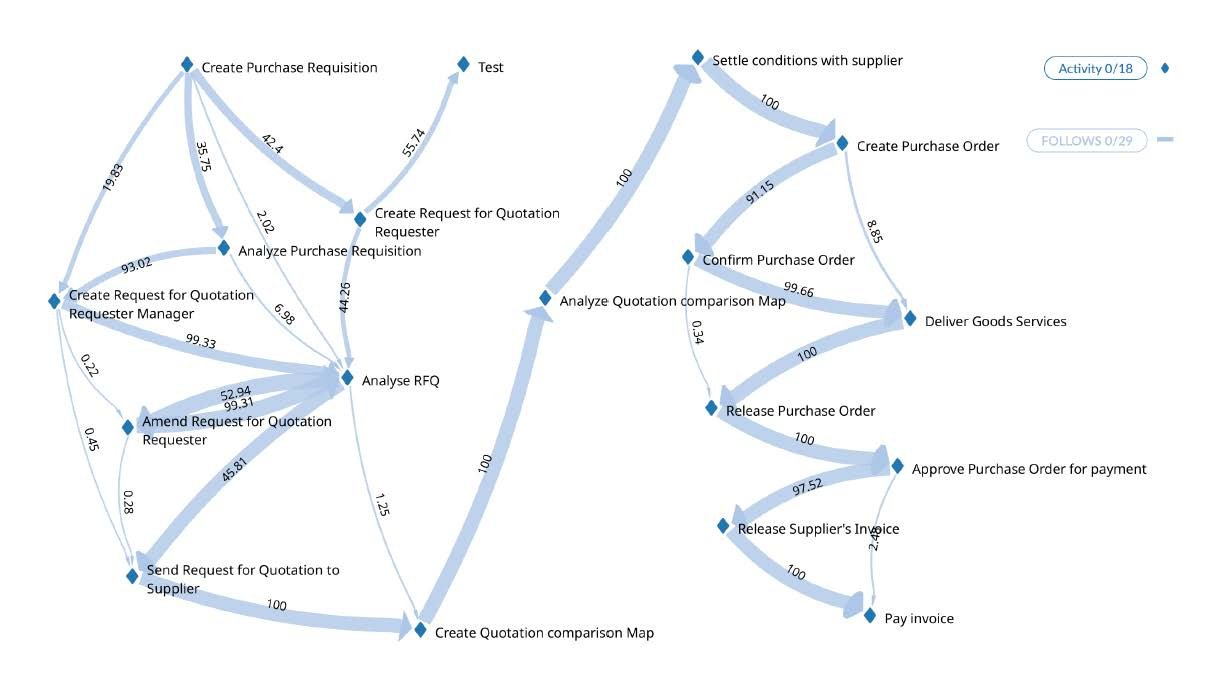
This image depicts the flow of transactions through the organisations financial system (ERP) with thicker lines showing higher volumes
In this example we can see the process flow and the transactional volume, who/what triggered it, which system logged it, and precise timestamps for each transaction. Specific transaction paths can also be quickly ascertained. This means that transactions anchor the architecture to reality by turning processes into multi-layered knowledge graphs for rapid understanding and insights, addressing the many common why, what, and how, type questions.
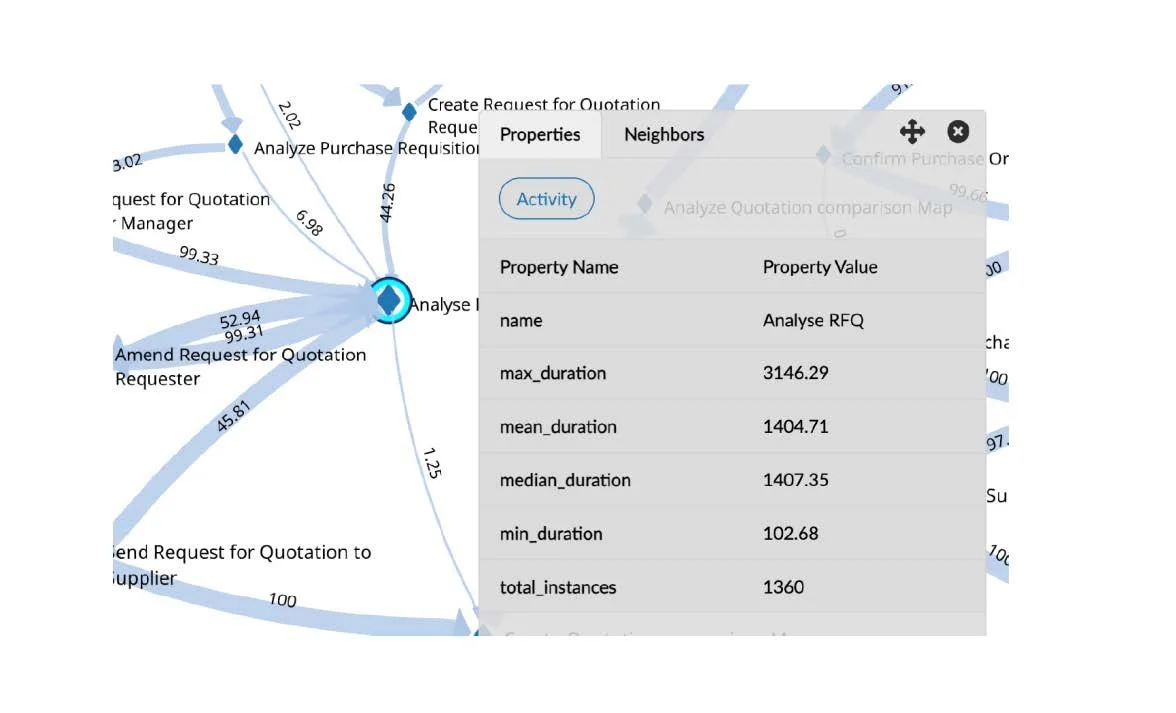
Here we can drill into the detail to explore the statistical analysis
Whilst we can analyse the actual process steps, quantification, and duration for the completion of a particular activity, we also have the ability to drill deeper into the data and analyse transactions to look for regular patterns and allowing us to compare multiple datasets if needed. The size of the node indicates the duration for the completion of the particular activity compared to the average, which means variation and deviation becomes clearer.
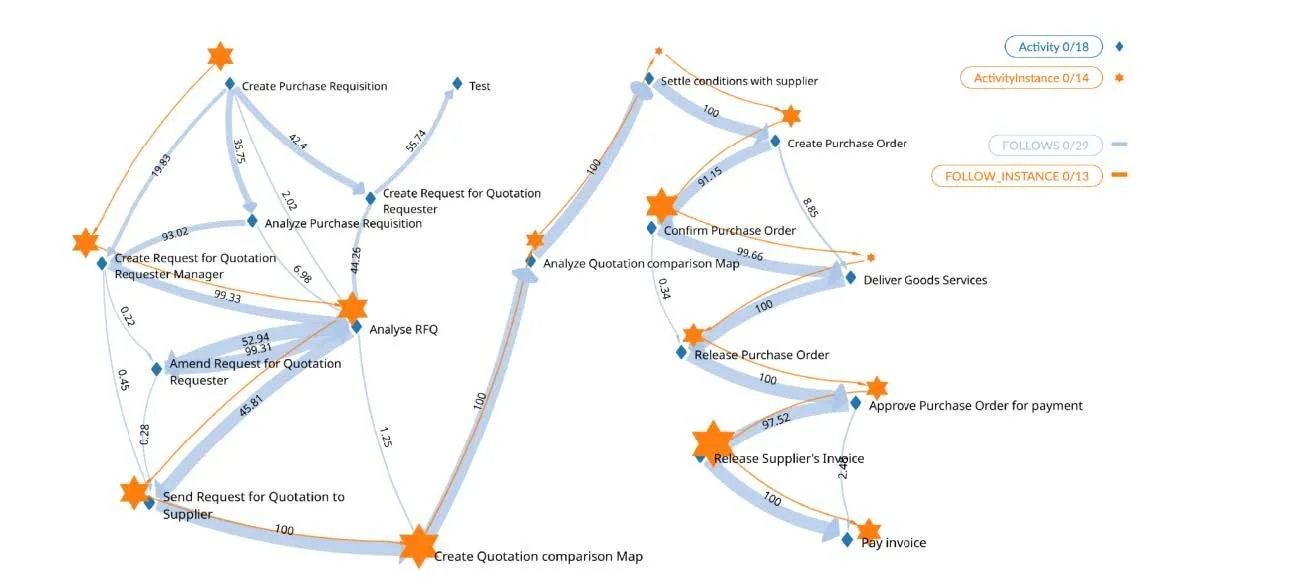
We can start to overlay specific transactions to see the route taken and delays that occurred (bigger stars)
By analysing the journey of particular activities, we are able to identify aspects of the actual transactions such as volume, mean pathways, transaction progression and cohort analysis. With Activity edges in place the shortest path and most used path was easily identified. Using data from the event log, the statistical distribution of steps, total time taken, and actual task completion time can be determined. The analysis showed that certain cases took 37 steps and over 200 days to finish, but the actual processing time required is only 2 days. This highlights potential issues with process inefficiencies, delays or constraints, and or non-value add activities. Through powerful query techniques we can start to ask questions like “Which process variants led to delays of over 5 days?” or “Cluster all cases where the process failed compliance rules.”
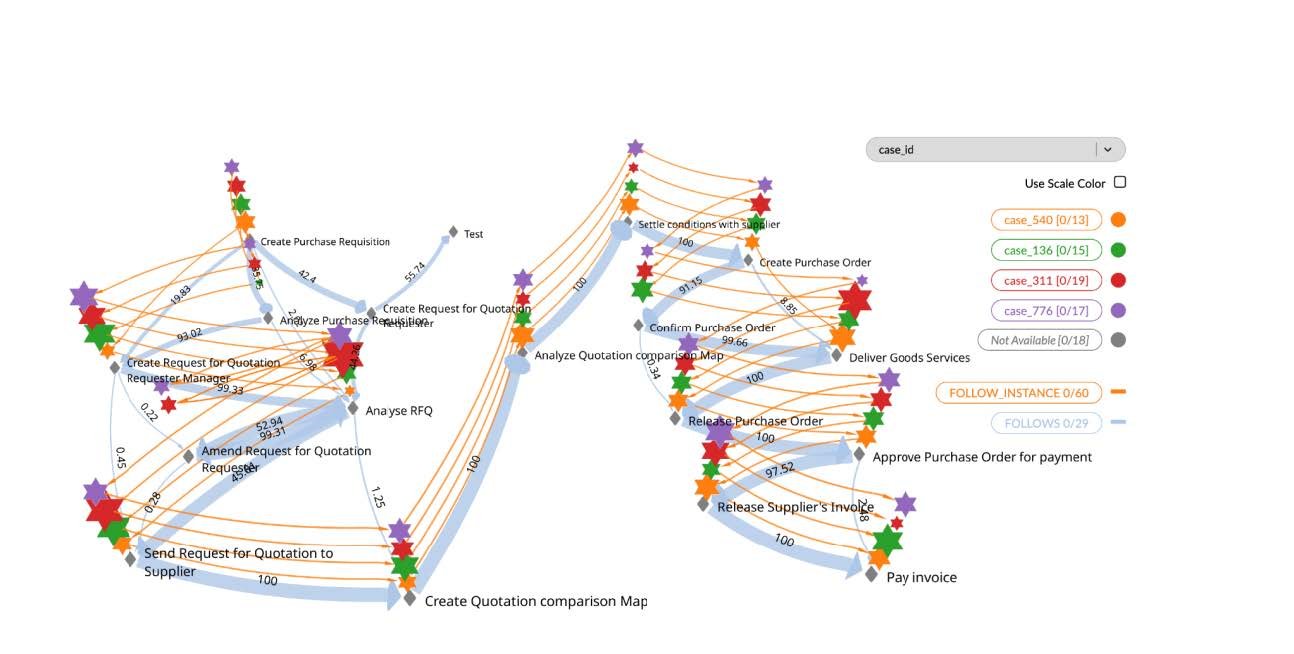
Overlaying multiple transactions to better understand variations in processing
When data is visualised in this way Enterprise Architects and leadership teams are able to optimise business processes and data flows and tune capacity where traffic is heavy, or business critical activities exist. Once identified legacy hops that add time or risk without value can be considered for removal. Any detection of sudden spikes on a least travelled edge may also provide indicators where further investigation is needed. GraphXR can help refine the design by blending both entity-centric and event-centric activity models.
There are numerous optimisation and innovation benefits gained from analysing and visualising structured and unstructured process and transactional data.
-
CIO’s/CTO’s can tie systems activity to real transaction volumes.
-
Operations teams have visibility of actual data and processing loads which can be used for planning and resource allocation.
-
Vulnerability and risk detection becomes clearer.
-
Inefficiencies can be identified and can be flagged for further analysis.
-
Automation opportunities can be explored.
-
Process optimisation and innovation can be driven and monitored.
-
Activity, Product and Decision Governance positions can be easily determined.
These tools and approaches enable organisations to not only document and understand the complexity levels in play but to actively position the organisation for greater resilience, sustainability, and value. It’s about uncovering, analysing, and understanding the actual paths data, systems, processes and people take.
By combining Enterprise Architecture 4.0 practices with GraphXR log file analysis and data visualisation, we gain not only clarity but the fact-based evidence and confidence to design, build and act.
-
-
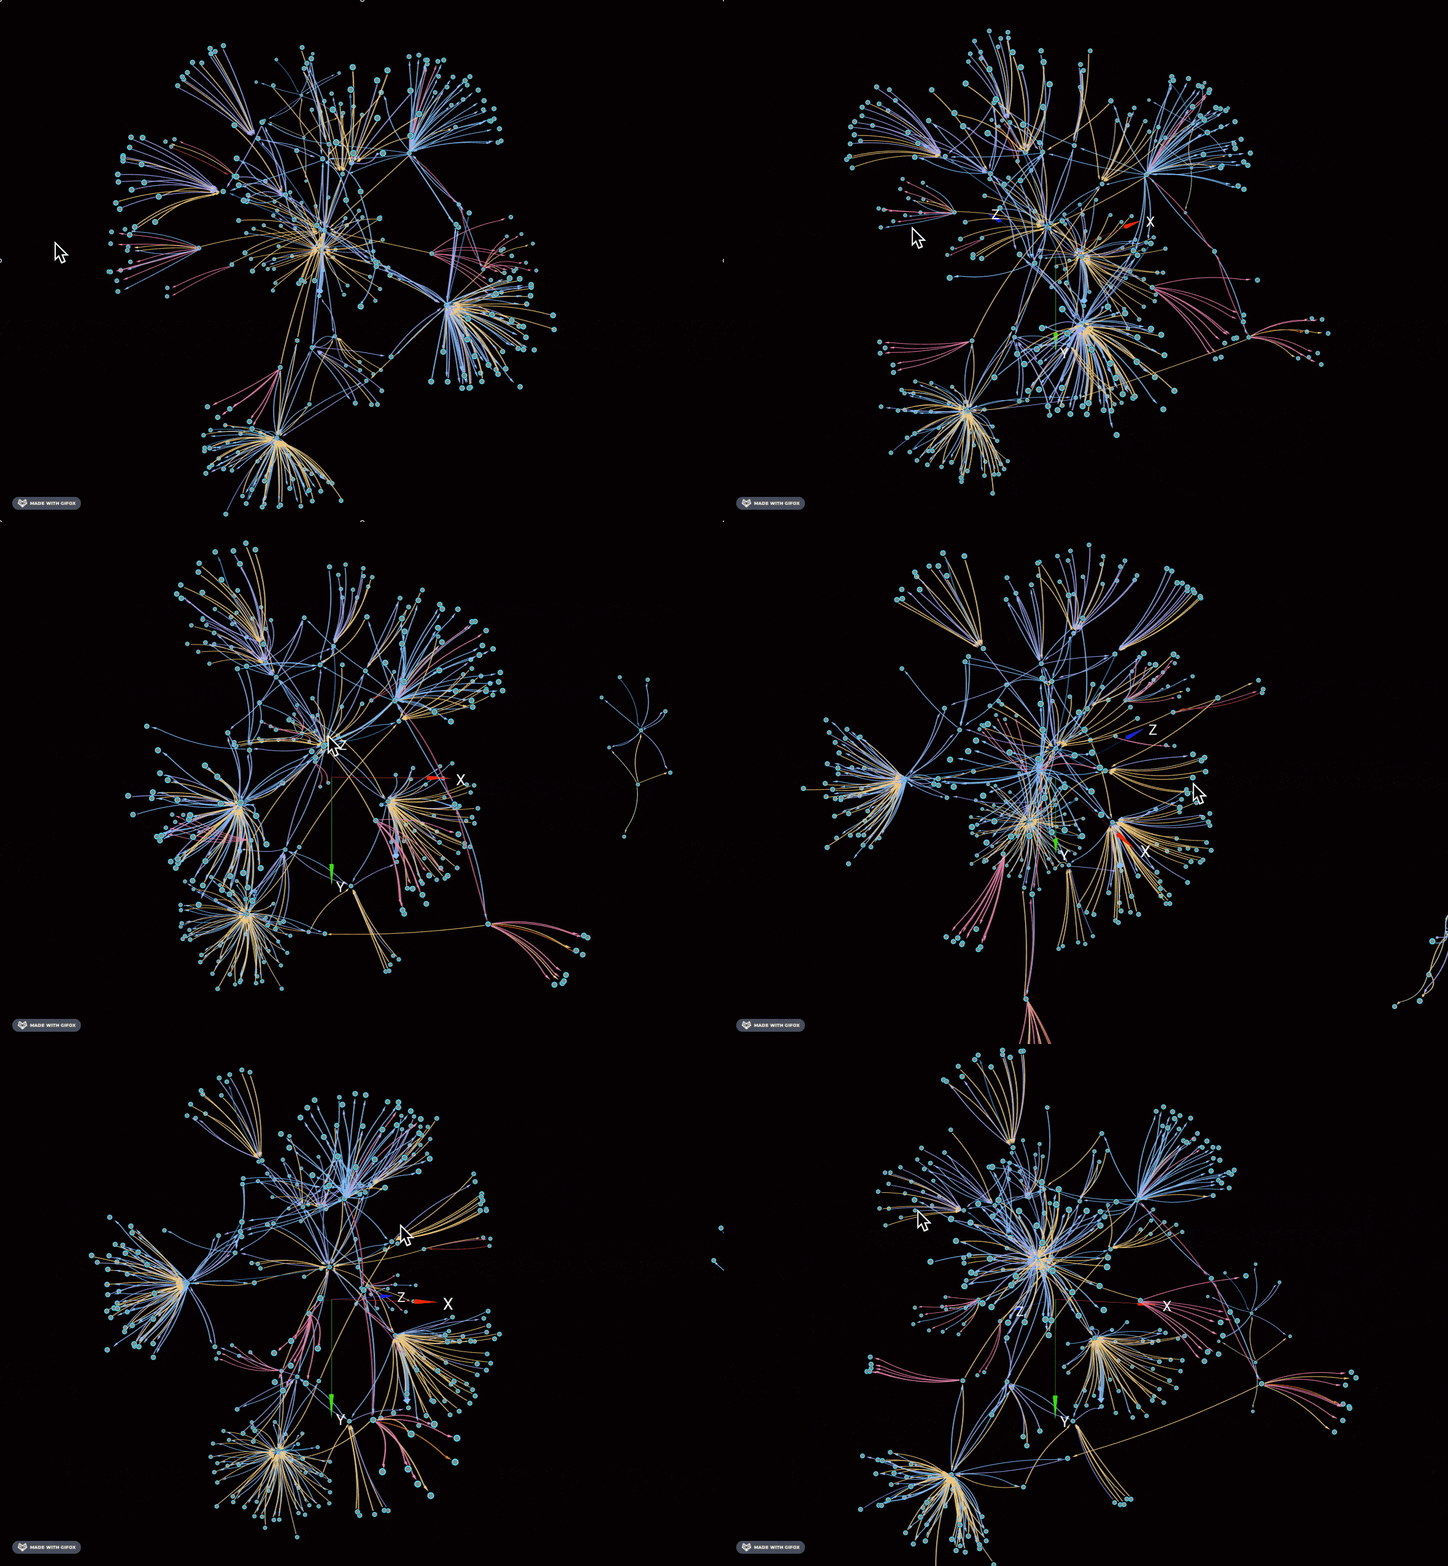
The Hidden Interweave of Business: Why Visibility is Your Greatest Asset
Every business operates within a vast, interconnected web of customers, suppliers, people, and events. Yet, very few can truly see and understand the intricate interweave of these relationships in real time.
The reality? Many organisations are flying blind.
For businesses that rely on multiple data stores, legacy systems, or specialized tools that don’t always talk to each other, the challenge is even greater. Critical insights are often buried in silos, trapped in incompatible formats, or lost in a maze of platforms. By the time the necessary data is gathered, cleaned, and interpreted, it’s often outdated—rendering decision-making slow, inefficient, or even misguided.
This lack of visibility isn’t just an operational headache; it’s a strategic and tactical vulnerability. Businesses today face increasing complexity, faster market shifts, and rising customer expectations. Without a clear view of interactions and dependencies, risks go unnoticed, opportunities slip away, and inefficiencies compound.
The Shift Towards Digitization
The landscape is changing. Digitisation is no longer a luxury, it’s a necessity. The ability to integrate, analyse, and visualise business interactions in real time is what sets resilient, adaptive organisations apart. Leaders must embrace tools and technologies that:
-
Unify Data Streams – Break down silos and consolidate critical information into a single, accessible source of truth.
-
Enable Contextual Understanding – Move beyond raw and transactional data to gain meaningful insights into critical relationships, trends, and impact.
-
Support Real-Time Decision Making – Harness AI and automation to provide timely, relevant intelligence when it’s needed.
Seeing the Bigger Picture
As digitisation accelerates, businesses must shift from simply collecting data to truly understanding it in context. It’s about visibility—knowing not just what’s happening but why it matters and how it impacts the broader ecosystem. The companies that can do this effectively will not only navigate complexity more efficiently but will also gain a competitive edge in an increasingly interconnected world.
You need to be ready to embrace the shift. It’s time to start seeing the bigger picture—because in business, clarity isn’t just power; it’s survival.
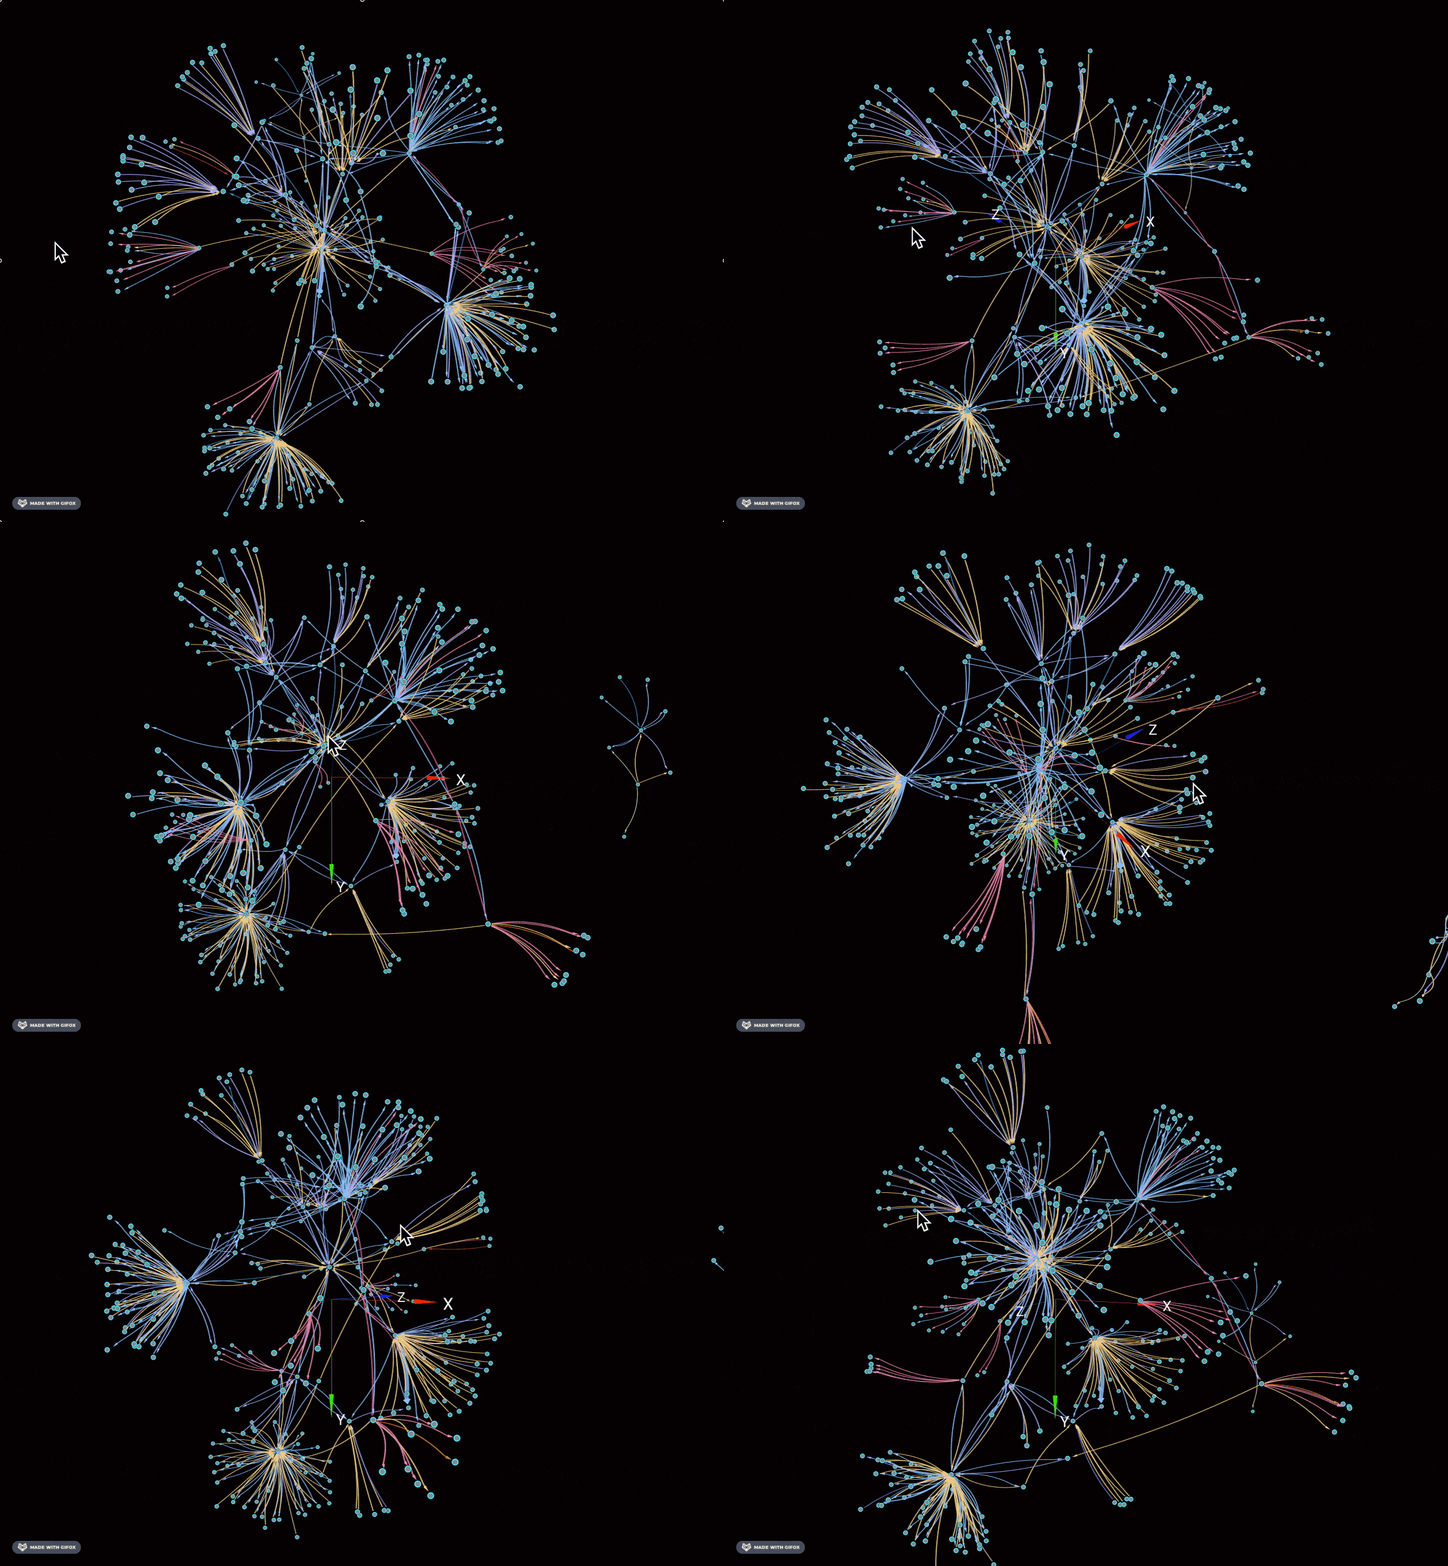
The Complex interplay of Organisations and their touch points
-
-
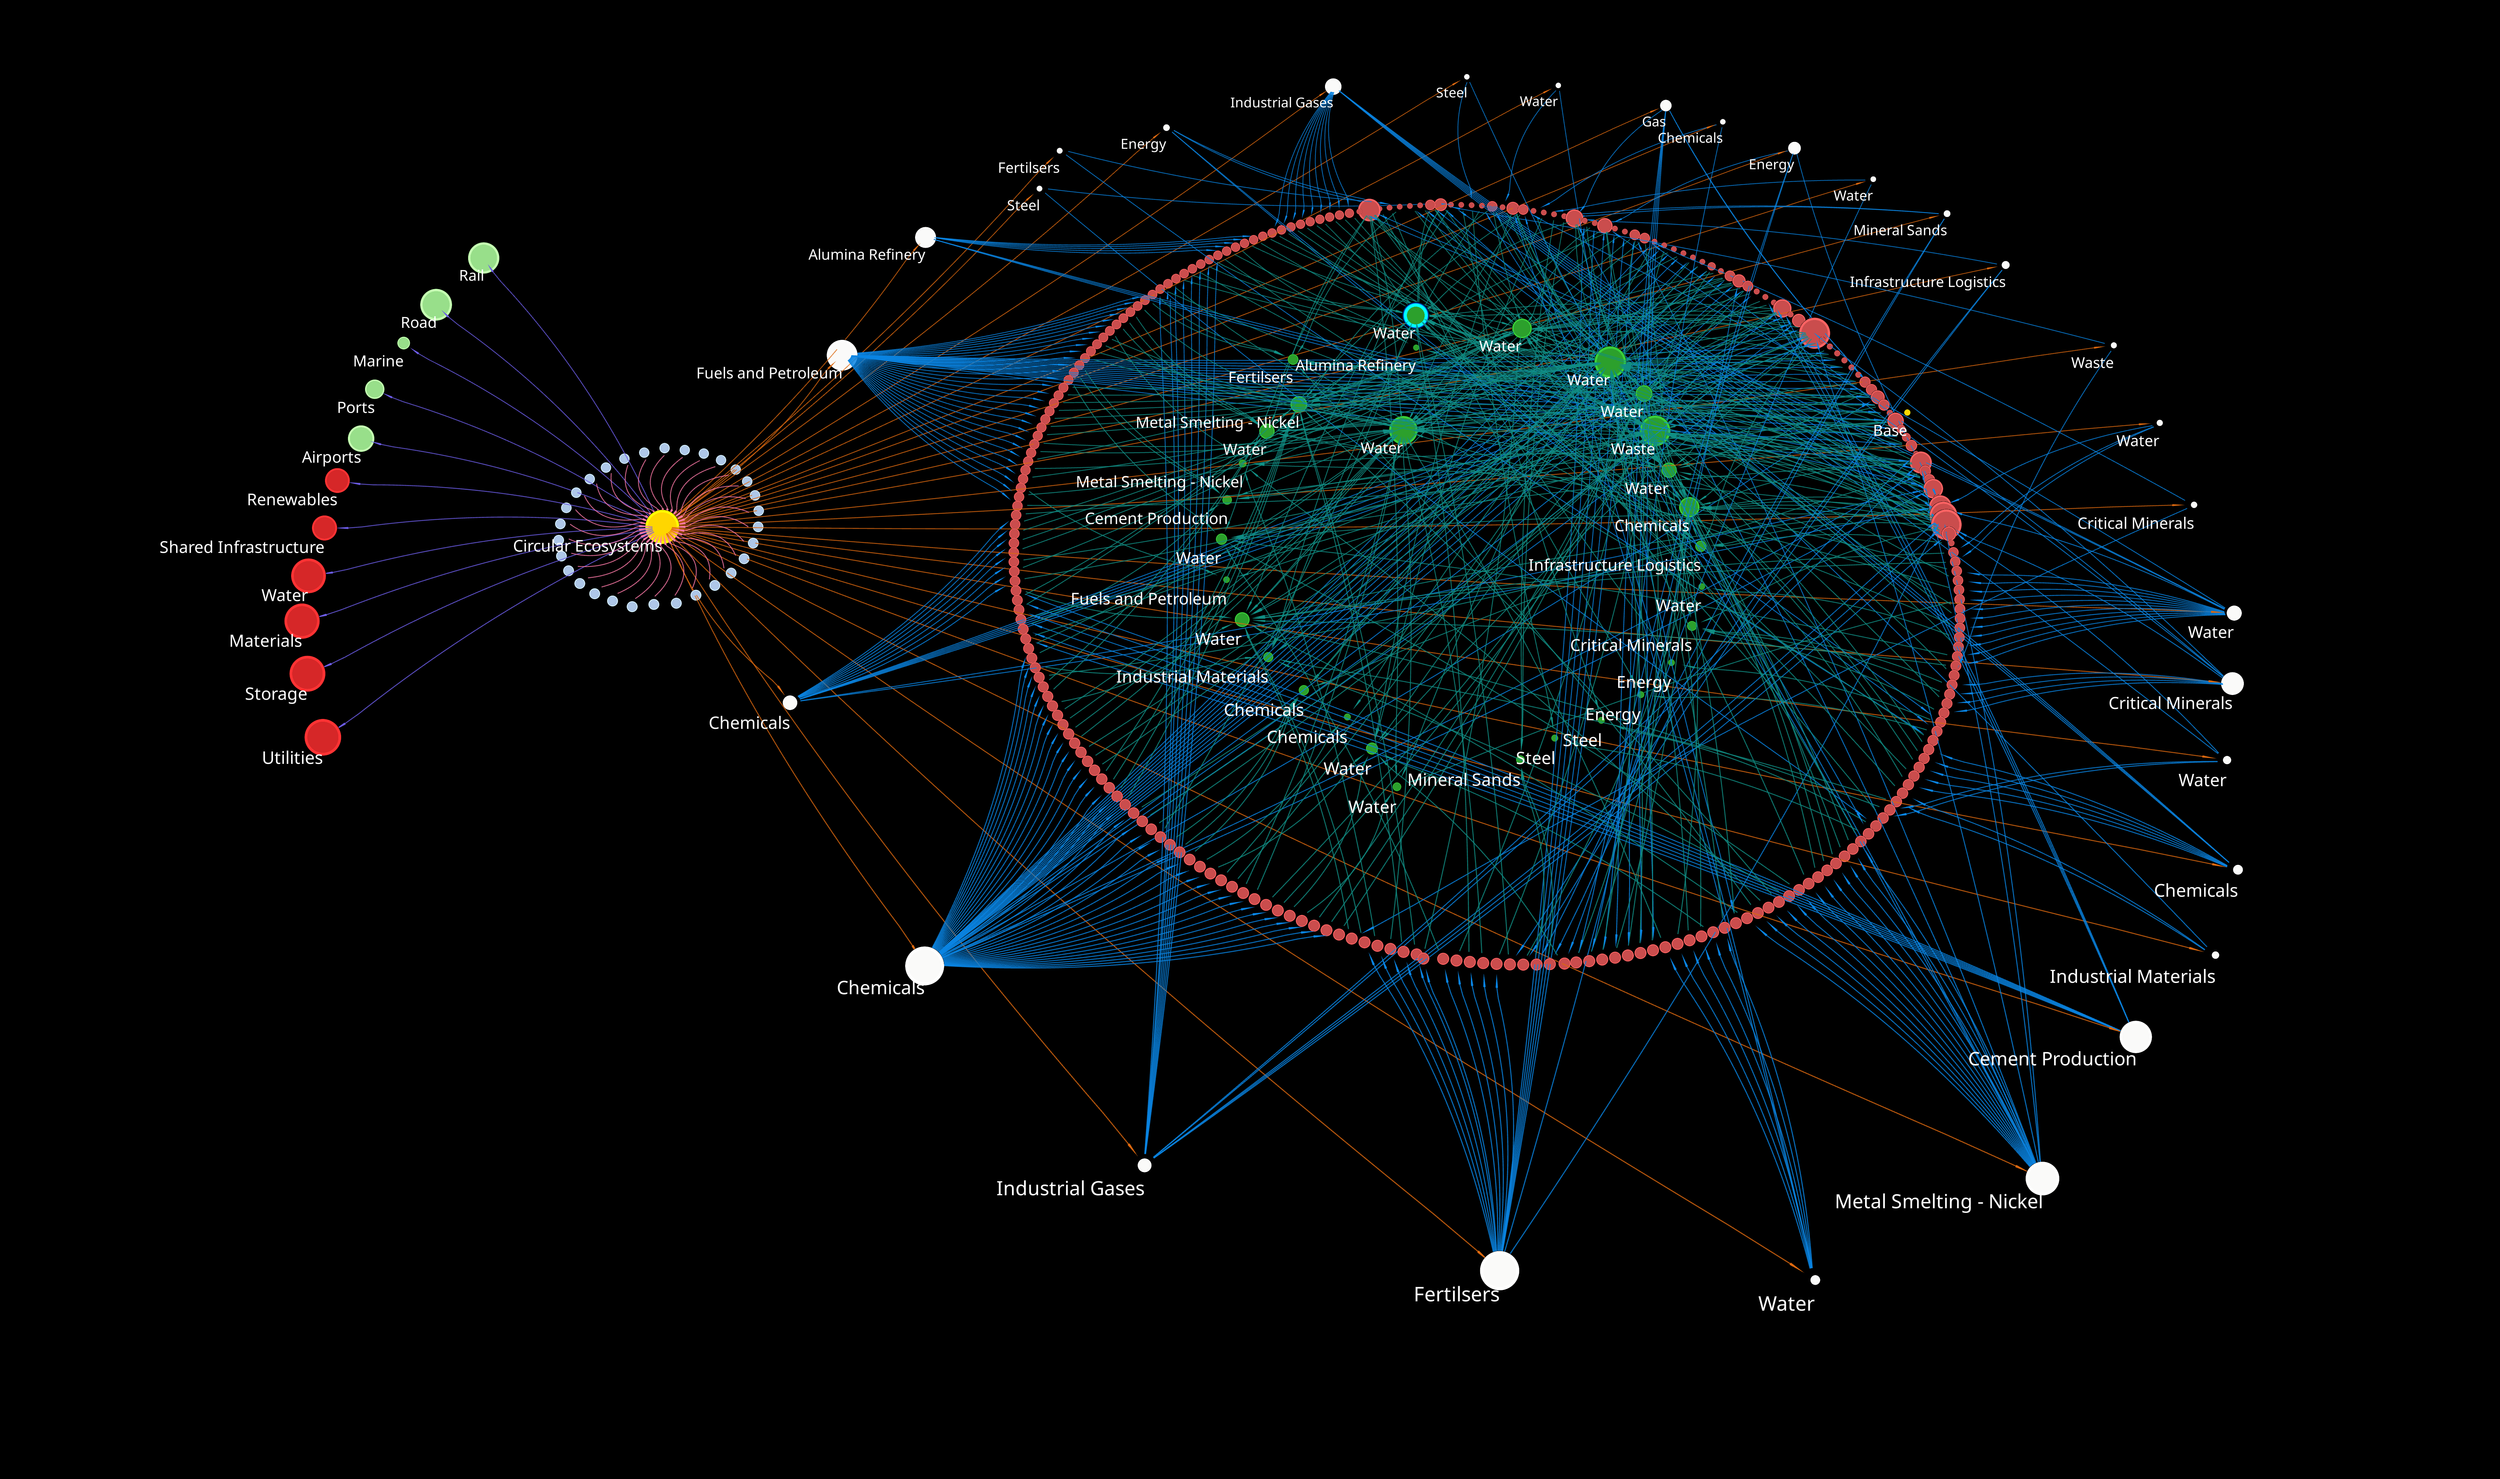
🌏 Transforming industries through circularity and industrial symbiosis!
The Kwinana Industries Council is paving the way for a groundbreaking approach to industrial symbiosis—with over 170 byproduct exchange contracts across 54 organisations. This is a prime example of how interconnected industrial ecosystems can operate efficiently and sustainably.
At Realising-Potential we’re proud to see the early-stage adoption of our Symbiosis Model, which enables our partner Circular Ecosystems to showcase how industrial symbiosis can be achieved and the power of circularity. By visualising data through advanced digital platforms, we’re uncovering strengths and capabilities that drive collaboration, resource efficiency, and resilience.
For example:
✅ The rapid analysis of cluster impacts when major operations like BHP’s Nickel West refinery temporarily shut down.
✅ Participants having visibility of dependencies, constraints, opportunities and impact.Seeing the big picture enables strategic alignment—whether it’s onboarding new entrants or adapting to industry changes. It helps to understand and manage the many respective agendas that are in play. Digital collaboration is the future of resource circularity, and we’re excited to support this shift.
Check out the WEF (World Economic Forum) article that highlights this transformative journey:
Link to WEF
Let’s continue to innovate, visualise, and unlock the potential of industrial symbiosis. 💡
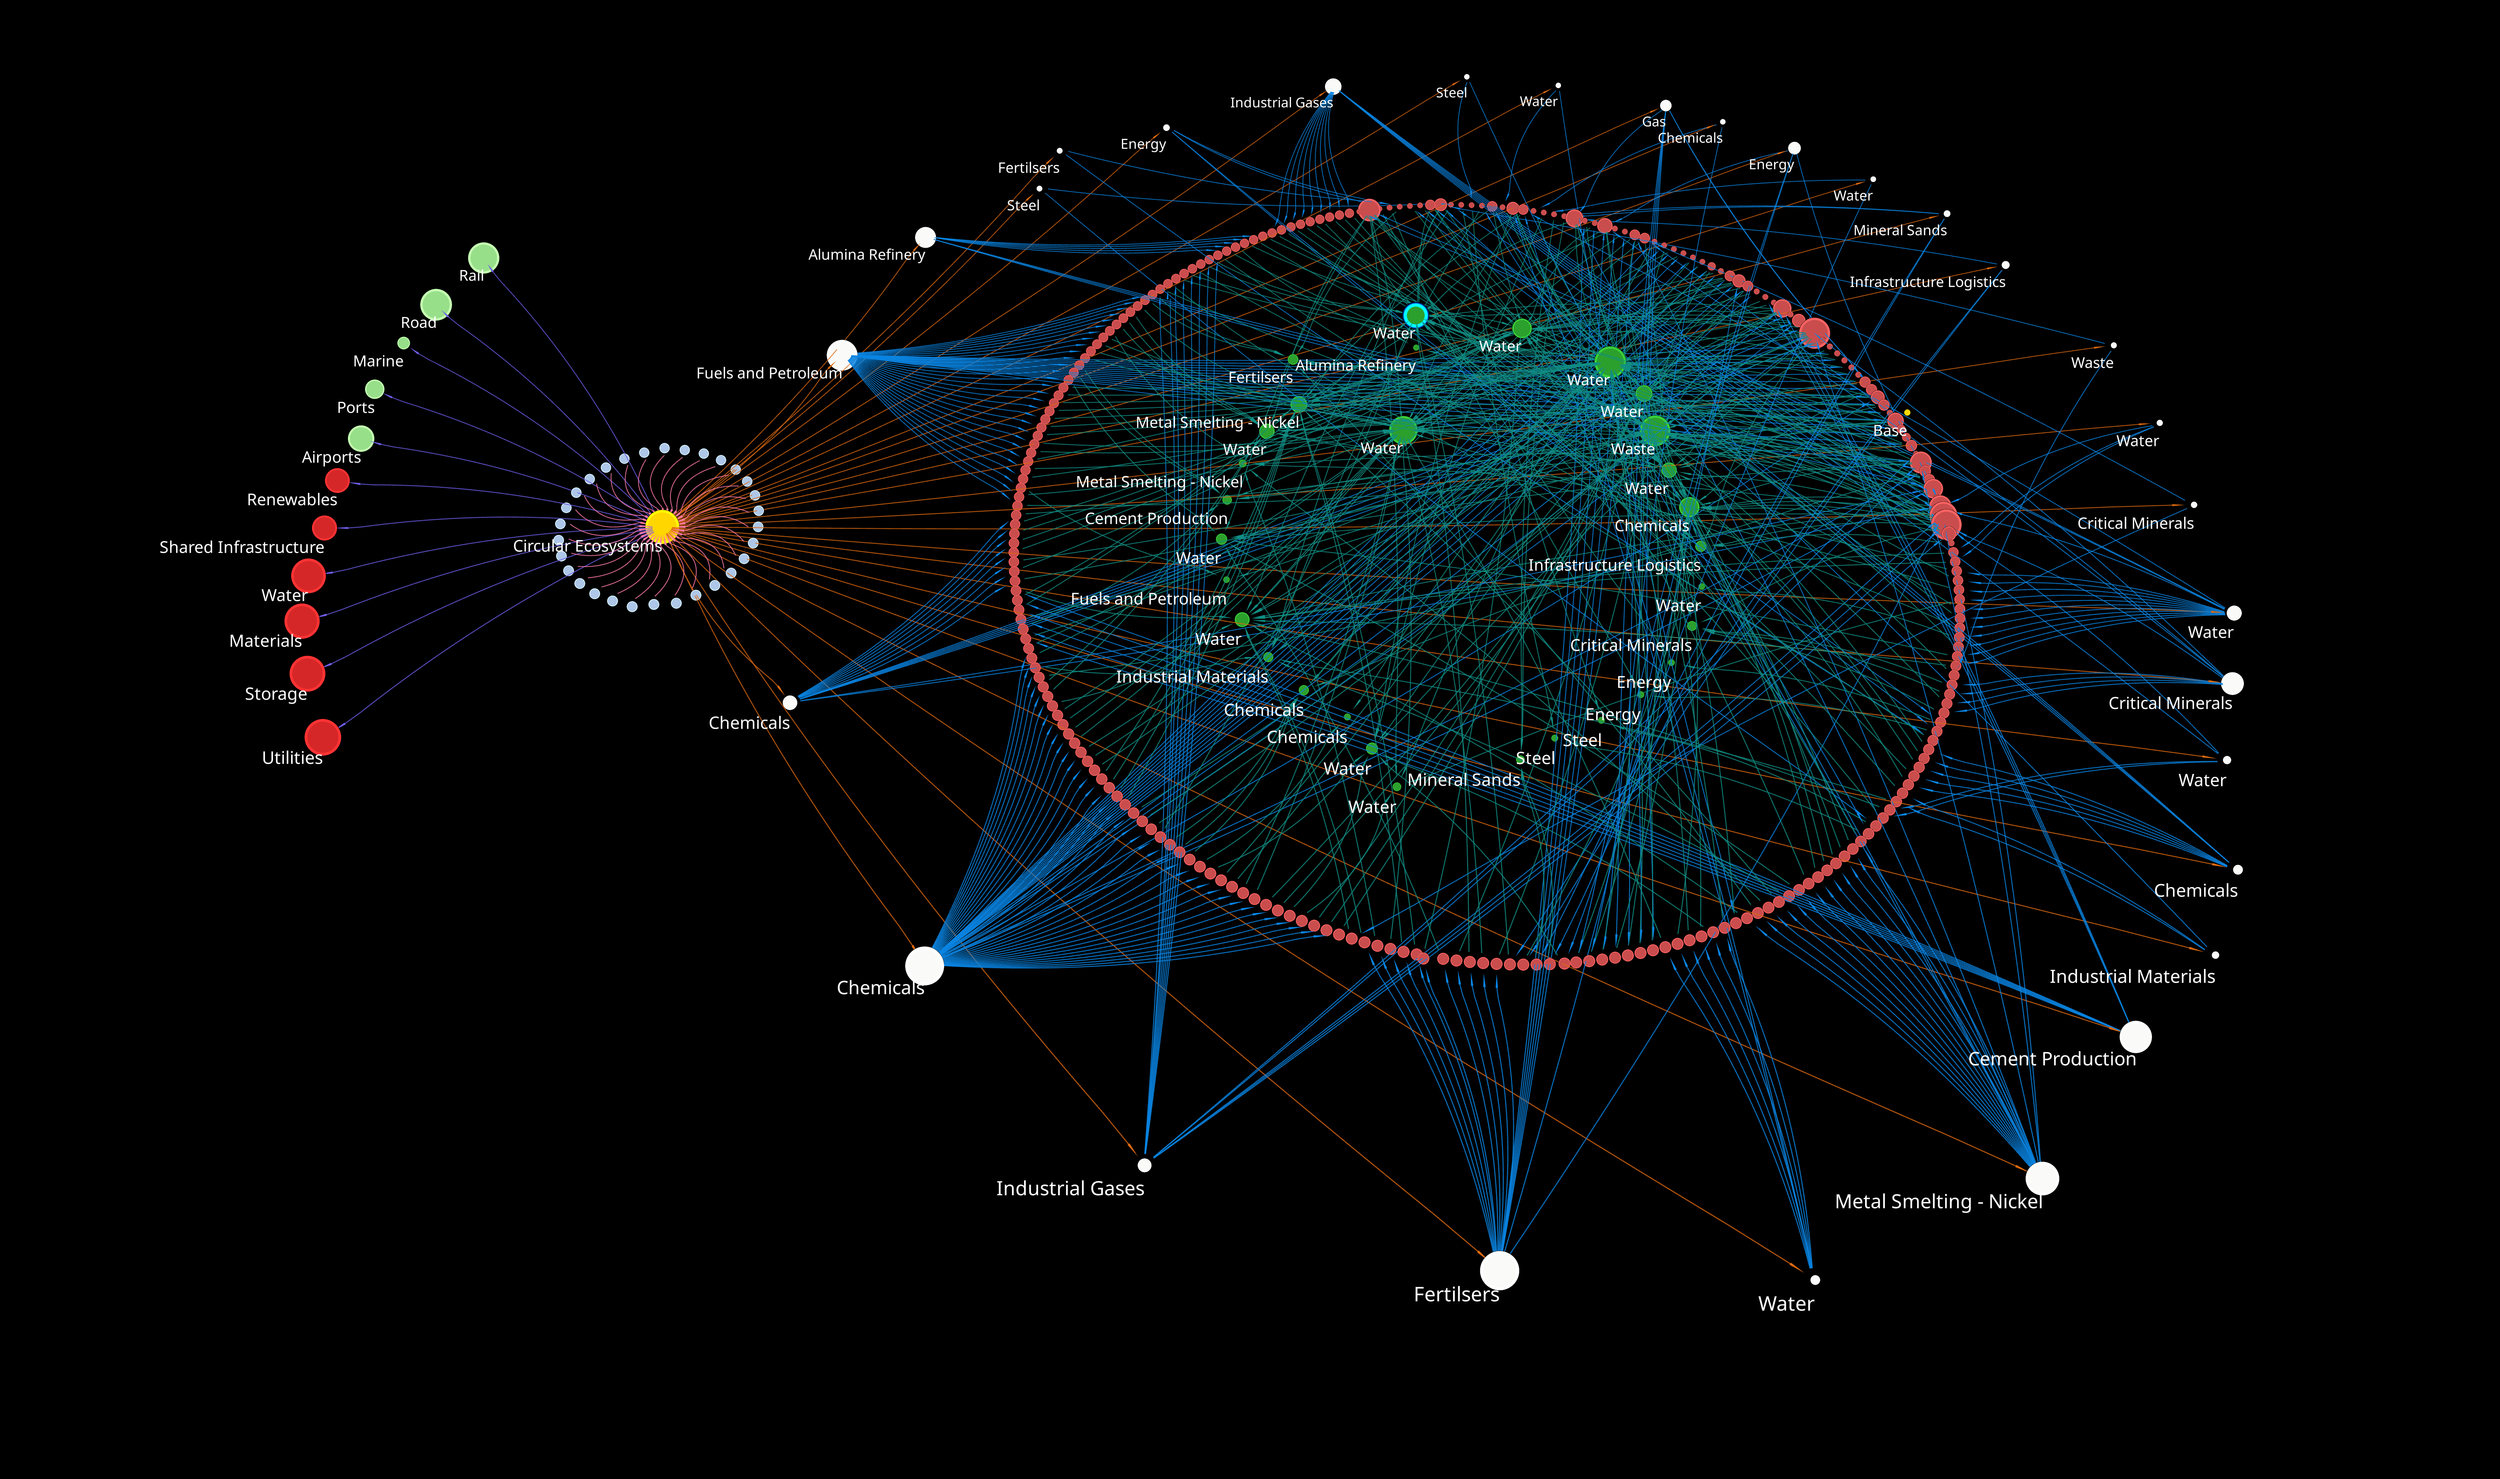
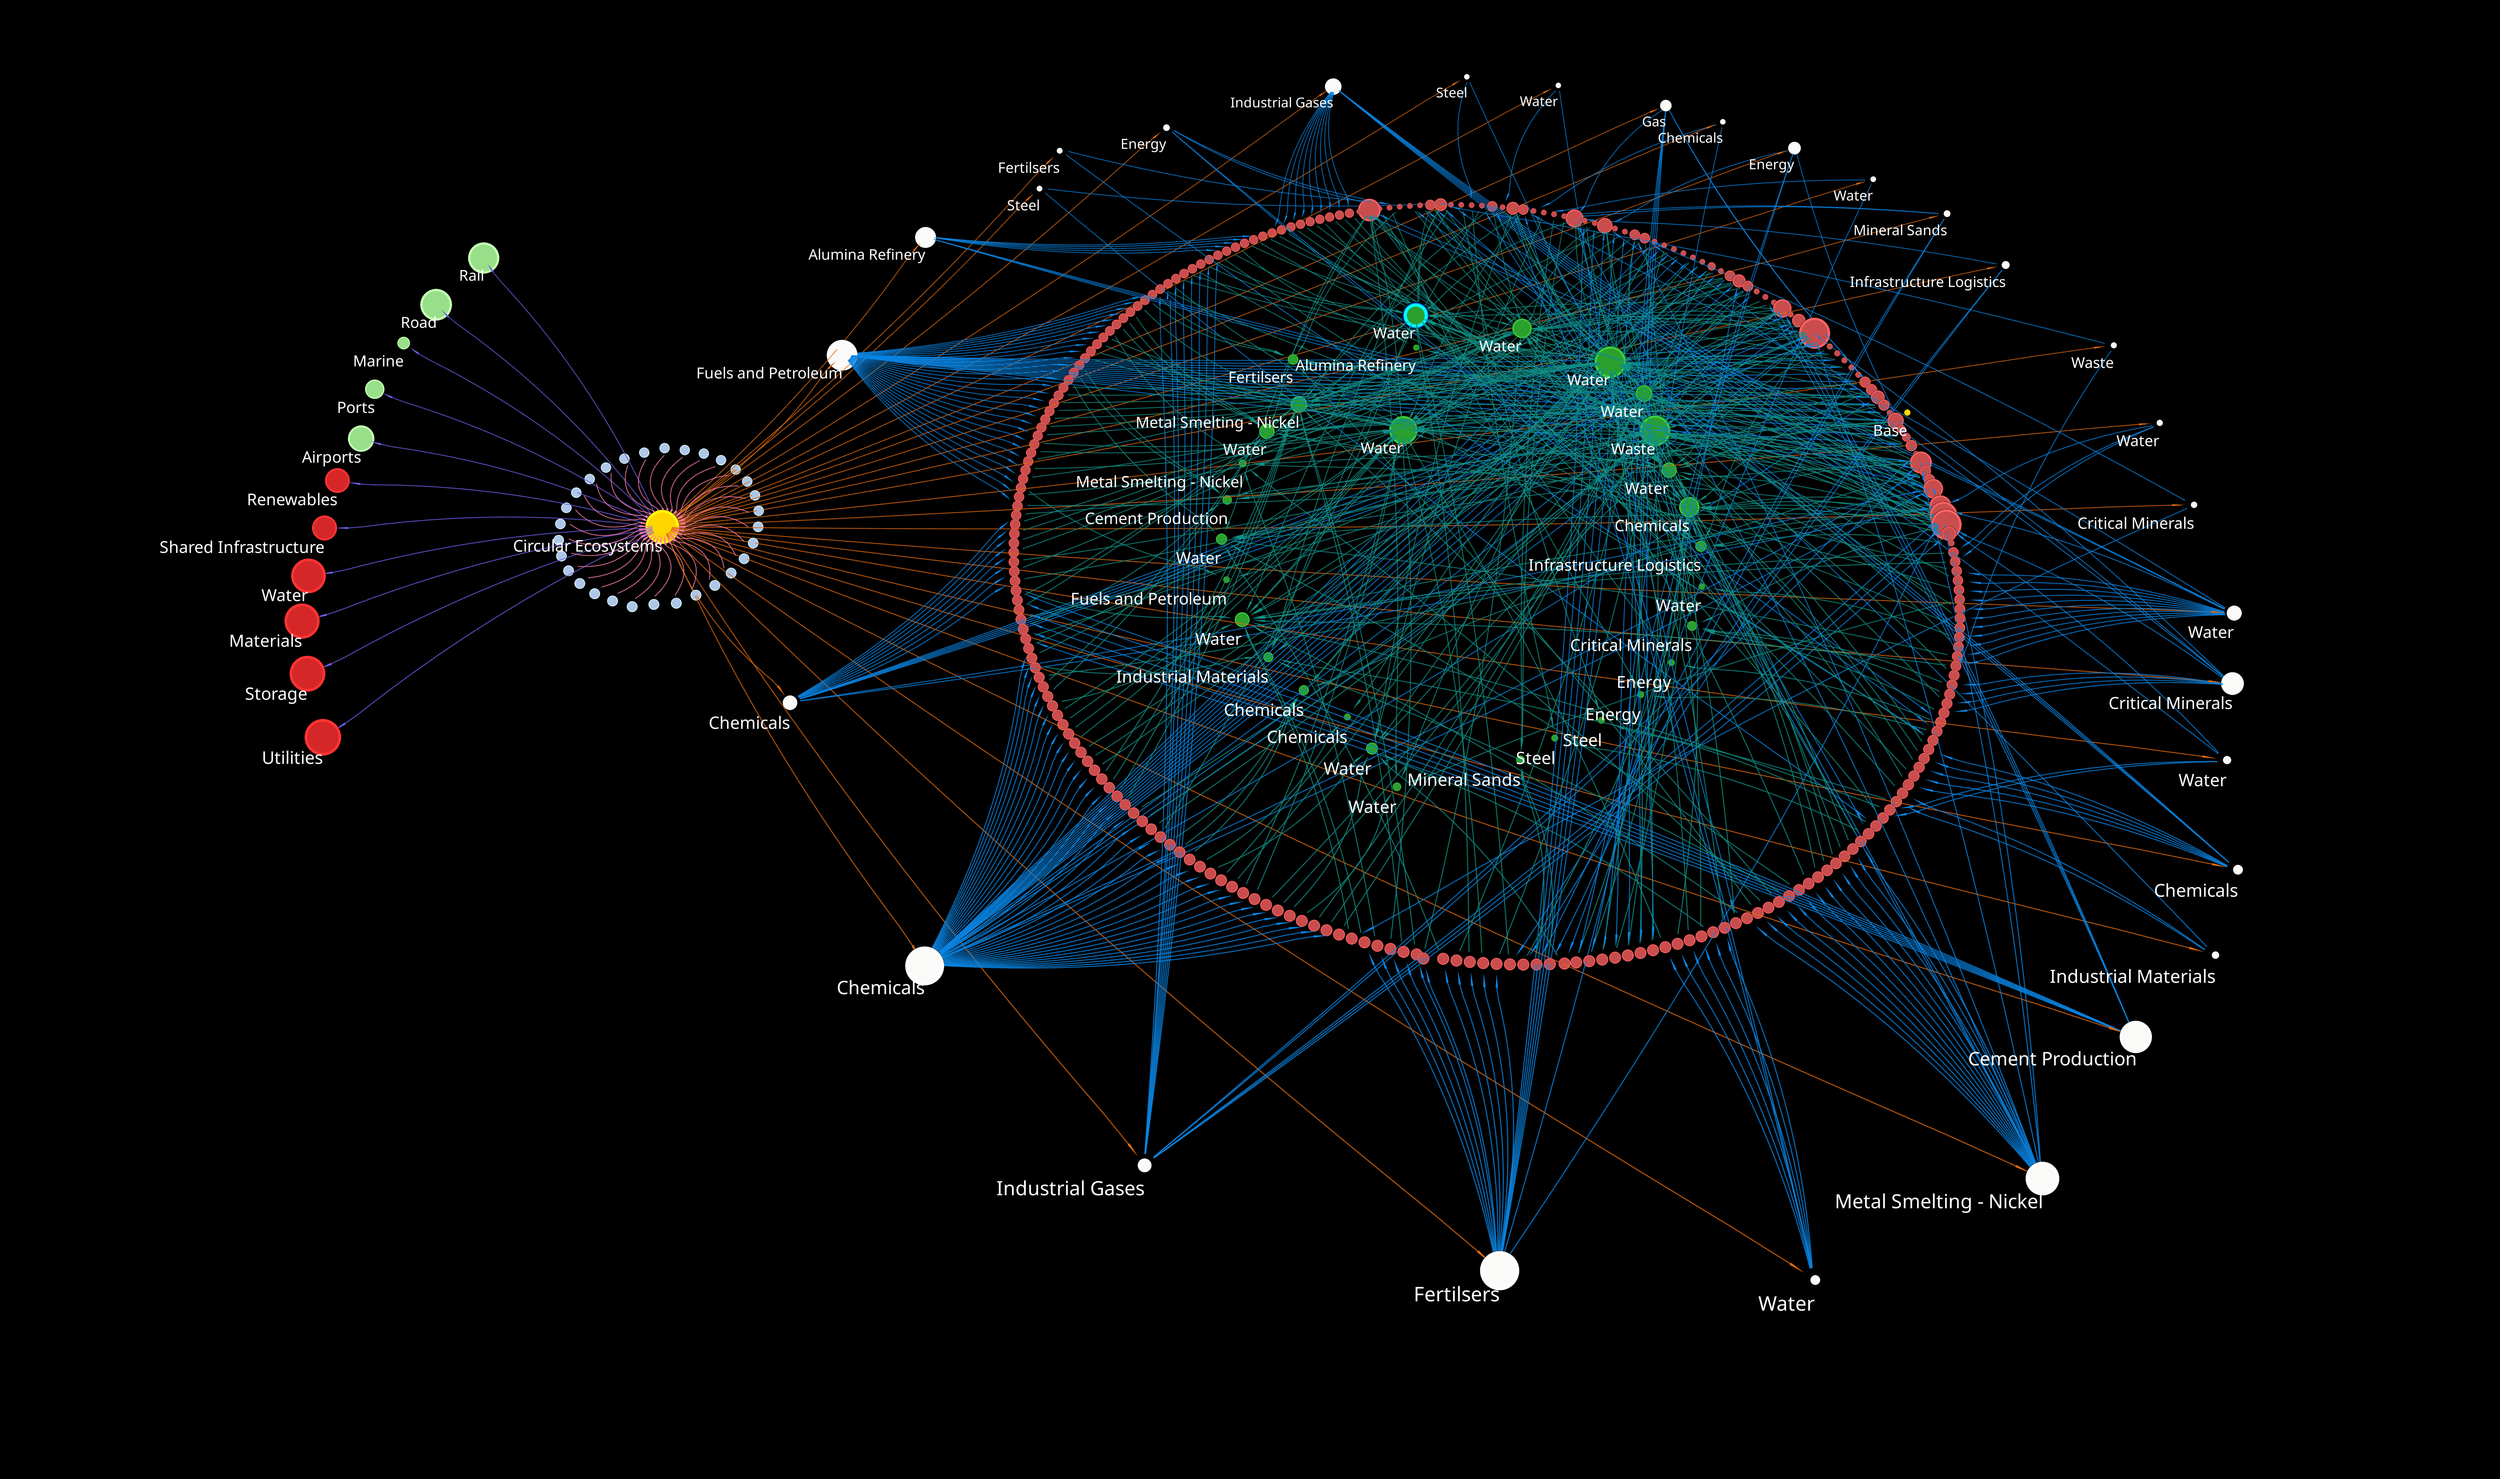
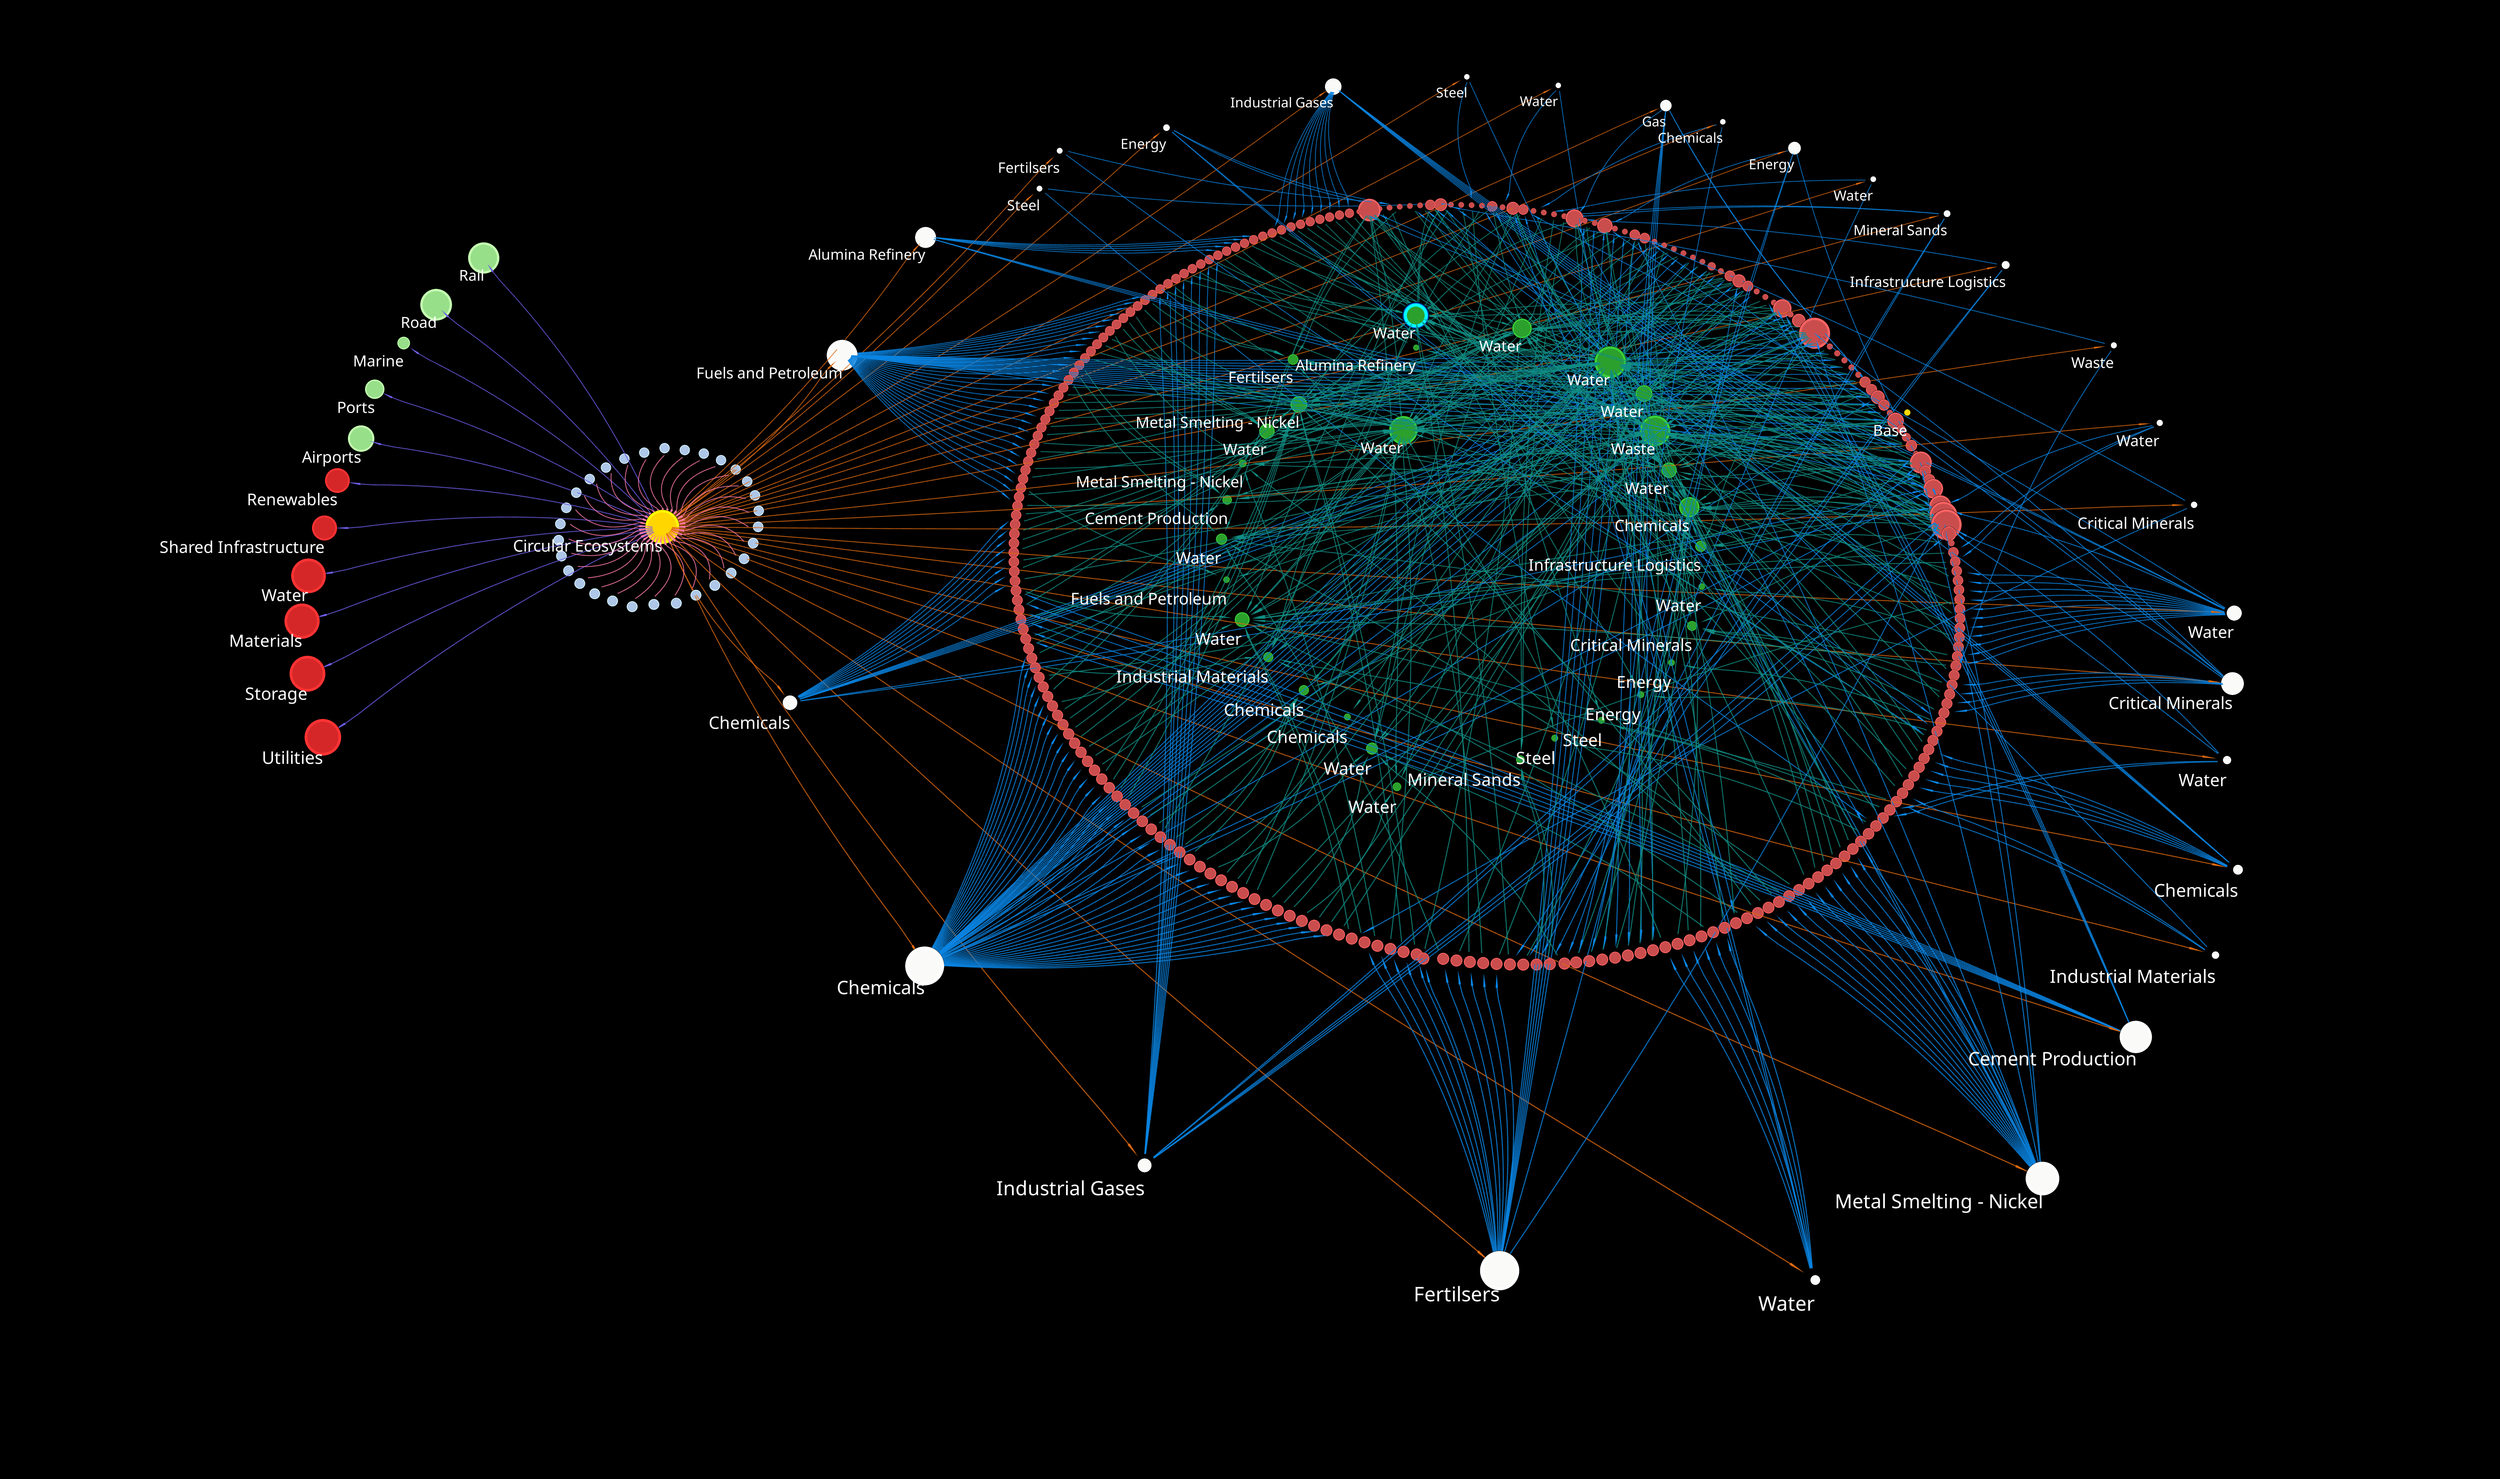
The Industrial Symbiosis Model – (aka. The Starship Enterprise)
-

Your Work Shapes the Future
Every decision you make, task you complete, and system you improve has a ripple effect. Whether you are building infrastructure, driving sustainability, innovating in healthcare, or championing circular economies, your work shapes the future in profound ways.
Understanding Relationships: Building Stronger Connections
When you can see how your work fits as part of a larger system, you can better understand the ripple effect and the impact it has. Every connection you strengthen – between a team and a tool, a system and a process, or a strategy and its execution, sets the foundation for more effective and impactful outcomes.
Unlocking Possibilities
People and data hold the key to understanding the ripple effect. Harnessing data in a specific way can deliver deeper insights into what works, what doesn’t, and what’s possible.
-
In Mining, use the ripple effect to minimise downtime and optimise output.
-
In Construction, use the ripple effect to analyse complex project workflows and relationships that can lead to delays and disputes.
-
In Healthcare, use the ripple effect to drive more personalised care.
Your work today shapes tomorrow’s ripple effect.
Contact us If you want to understand more about your ripple effect.

The ripple effect
-
-
Putting salespeople in the right place
Written by Micky Walton
Holding a salesperson accountable for their KPIs can be tricky.
We have plenty of reports and dashboards that show us standard metrics such as closed sales revenues, completed meetings, sent emails, emailed proposals and so on.
However, our understanding of the approach each salesperson has taken and what we are asking of them is often overlooked as we spend all of our time in the sales trenches trying to do more.
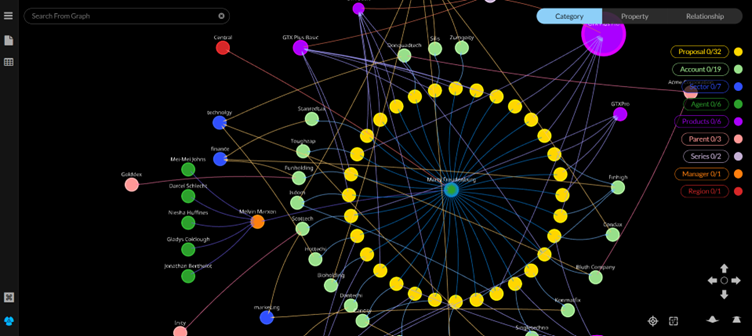
Recently, we have started looking at CRM and other sales datasets in a different way. By visualising and analysing the data with a fresh approach, we can start to see the universe through the lens of one of our salespeople.
Using a sales dataset, the diagram below shows not only the 32 active proposals our example salesperson Marty Fruedenberg is working on, but how each of these are connected within our wider organisation. It helps is see the prospects and clients Marty is engaged with, the product set he is actively selling into these businesses, the regions and sectors he is active within, and who within our organisation he is working alongside to close these deals.
As sales leaders, it helps us start to ask better questions about what we are asking from our salespeople and where they need help. If I am the Sales Manager in this example, I start to wonder whether Marty is our best salesperson when it comes to GTX Plus Pro, or is that our flagship product which is our easiest sale? I start to question whether I should reshape our team away from a geographic sales focus, to possibly a product-based or sector-based sales approach. When I look at Marty’s conversion rate, its 3 times below the average close across the business. Why is this? Is it lack of training, poor time management, an incompatible incentivisation plan or is he a better Account Manager than he is a BDM?
In my experience I have often formed views based on potential bias or a lack of understanding of what was really going on within my team. This new type of visibility gives me the chance to get my fellow management team on the same page and be more confident about what we should be doing more of, and what we should be doing less of.
Schedule a time with us to find out more.
-
The Starship Enterprise
Written by Jackie O’Dowd
Most people have heard of Star Trek created by Gene Roddenberry. It sparked our imaginations and transported us at warp speed into a future where interplanetary travel was commonplace, diversity and inclusion were the norm and there was a heavy reliance on data and information. From the screen on the bridge, usually under the command of Captain James T. Kirk we could see an endless array of planets and stars, we could see things that were known and things that were unknown.
Organisations are creating their own version of the ‘Starship Enterprise’ to see what they need to see and explore opportunity by using graphical and data visualisation tools, where nodes represent organisations, industries, people, locations or other key data elements. Linkages, relationships, and context can be quickly determined and understood, and we know what galaxy we are in. We can see where the gains and losses of one organisation can impact and influence another. Using technologies such as these and being able to navigate and explore through the data we can traverse the structures, relationships, norms and anomalies. It provides a shared view. Most importantly, we get to see what makes sense, where there is exposure and where there is opportunity.
Circular Ecosystems an Australian based organisation has created what they have nick-named ‘Starship Enterprise’ for industrial symbiosis. It provides a holistic view which for them is a view of the industrial galaxy, the participants, the products and materials, the trade events and frequency. It has started crucial conversations, critical thinking and started a journey into the future.
Start Trek shows us sometimes things need to be seen to be believed, so we can better react and respond.
Schedule a time with us to find out more.