Author: bvfug

  • De-risking Data Migration

    De-risking Data Migration

    Written by Jackie ‘O’Dowd

    Executing a data migration from one Enterprise System to another is a complex, risky process that requires careful consideration, planning, execution, and validation.

    There are multiple steps involved including:

    • Planning and Scoping

    • Data Quality Assessment and Cleansing

    • Determining the Approach and Tools

    • The Data Transformation and Integration Process

    • Testing and Validation

    Attention to detail in each of these steps helps to ensure that the data migration is effective, efficient, secure, and successful.

    It has been our experience that using data visualisation and analytics tools as part of data migration approach provides significant advantages when dealing with complex, interconnected data. Some methods tend to make hard work of mapping complex relationships and dependencies.

    There are many things to think about when working through a data migration process. We tend to think its just about moving the data from one system to another. But in actual fact its much more than that. It’s about determining what data to migrate, understanding data hierarchies, ensuring that schemas align, ensuring retention schedules are aligned and privacy regulations met.

    A little bit of definition work upfront means a whole lot less pain at the end.

    Schedule a time with us to get started.

  • Winter is coming – its essential you know your opportunity.

    Winter is coming – its essential you know your opportunity.

    Written by Brian Higson

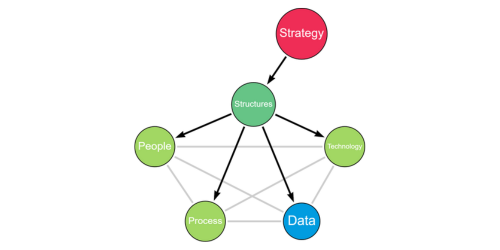
    For those fans of the Games of Thrones medieval fantasy, in the first series we are introduced to the various geographical settings and the characters in the show. One of the lead characters is Ned Stark, we see him getting increasingly entwined in court politics after the king chooses him to replace the recently deceased chief administrator (“Hand of the King”). He is forced to relocate to King’s landing, leaving some of his family behind, he starts the complex journey of understanding Strategy, Structures, People, Processes, Politics, History, and Governance. Throughout the episode we are constantly reminded that “Winter is Coming” and so the scene is set…

    So, what has this got to do with knowing your opportunity?

    You only need to watch the news or read online feeds to be reminded that all is not well in our world as we try to guess what impact this will have on the future operations of our organisations as we endeavour to position ourselves to quickly respond to these changing conditions and continue to meet our operational goals, securing our ongoing position.

    We can’t do this unless we have a good understanding of what we have, what opportunities we are currently addressing, and the opportunities we are potentially missing? The problem is we don’t have a crystal ball to foretell the future, but we know from history that when things do start to get unstable, business spending is restricted whilst we all try work out what is happening.

    Within most organisations we have purposely collected information in various repositories, sales in financial systems or spreadsheets, customer and prospect contact information in CRM’s (albeit of varying quality and accuracy), and internal and external correspondence in documents and emails. We rely on key people within the organisations to collate and make sense of this, let’s call them the “super-connectors”. When times get tough, cash is tight, and the market is changing, we often lose access to these “super-connectors” and things don’t quite work as well as they once did.

    So how do we minimize this emerging risk?

    We supplement the structured corporate information that we collated within our core systems with increasing volumes of unstructured data that tends to be scattered across our network drives and various repositories to try and make sense of the world and to identify potential opportunities that have lower barriers to entry. Whilst we know we have sold one product to an existing client, what other products in our offering may they be interested in? We have already done a lot of the hard work in establishing our relationship with them, they have bought from us previously so all the billing and approval processes are already in place, we have contacts within their operation that can help us navigate into other sectors, and yet we spend most of our time trying to identify new candidates and new customers that we know will take time and effort. Time may not be our friend.

    If you can relate to this scenario, we have assisted other organisations by importing their data into our SightXR data analytics and visualization platform to help identify sales opportunities from within this new data store.

    The process is simple, you provide us with the data you have available, we produce the model and together we analyse, then visualize the data to identify opportunities.

    Schedule a time with us to get started.

  • Explorative and Explanative Analysis – why you need both.

    Explorative and Explanative Analysis – why you need both.

    Written by Jackie O’Dowd

    Exploring data starts with a data set of some sort. The data set can be structured data as in a CSV file, it may be a transaction file from an ERP or other enterprise system, or it can be unstructured data such as a text-based document. Visualising data provides a way to explore it, to observe the patterns, relationships, points of interest and anomalies, in other words to see what’s there. Seeing the data in context is all important, especially when we need to understand the relationships between people, organisations and things.

    Exploration helps us to better understand and become familiar with the data we have, and typically starts with a question to answer, a hypothesis, a specific problem to solve, or a curiosity.

    Exploration is an often-underutilised approach to analysis. Visualised data can help to conceptualise, synthesise, and strategise. It is an effective way to think about and think through the problems we are trying to solve and the challenges we face. Sometimes it can simply be about considering what’s possible or what we need to consider. One recent example being an internal legal team looking for special and non-standard liabilities and indemnification clauses in order to explore ways of minimising risk.

    Explanatory analysis on the other hand is about what the data tells us, the data story or point of view. It’s about communicating the what, when, where and who of data. When a shared, interactive model of the data is created it enables teams to bring diverse thinking and different perspectives to the questioning, data story or narration. It is an effective way of harnessing the combined digital and human capability.

    For data visualisation we use SightXR Legal which means data can be seen and navigated in context and users can interact with it. It supports both exploration and explanation. Looking at data in different ways is important, given that we know that human senses habituate, and we can often overlook and miss obvious things in the data. Dave Snowden often tells the story of the radiologists that missed seeing an image of a gorilla in a X-ray, even though it was multiple times bigger than a cancer nodule. When data is visualised using tools like SightXR Legal, it helps us to move from the abstract to the detail and from then detail to the abstract. It augments e-discovery, exploration and explanation, and helps individuals and teams to make better sense of the data and information they have. It can even help spot the hidden gorilla.

    The value of explorative and explanative analysis is not only in the insight and foresight that its provides, but the value of being able to clarify, prepare summaries, improve a team’s questioning, enhance knowledge sharing and positioning ability. Value is realised by using data in a way that it can make a difference.

  • Warm Data – how legal firms are starting to leverage it

    Warm Data – how legal firms are starting to leverage it

    Written by Jackie ‘O’Dowd

    Data, information and analytics is considered a business-as-usual activity by most legal firms. But in fact, it is the complete opposite. Increasingly, legal firms are starting to see how other sectors such as Construction, Health and Manufacturing are leveraging data and especially warm data.

    We see most legal firms assessing the benefits technologies such as Artificial Intelligence can deliver, and there is no doubt AI will deliver specific capabilities, but they are missing the warm data thread. This is a lesson that can be learned from other sectors.

    Warm data is a specific kind of data, it is information about interrelationships. The term warm data was first used by Nora Bateson several years ago to describe interrelationality. Warm data captures the qualitative dynamics offering another dimension of understanding and insight from what otherwise can be a business-as-usual e-discovery.

    Relationships can be complex or simple, isolated or part of a complex interweave. When we can see them, observe them, and navigate them we can start to make-sense of them, to better understand the depth, breadth, and reach.

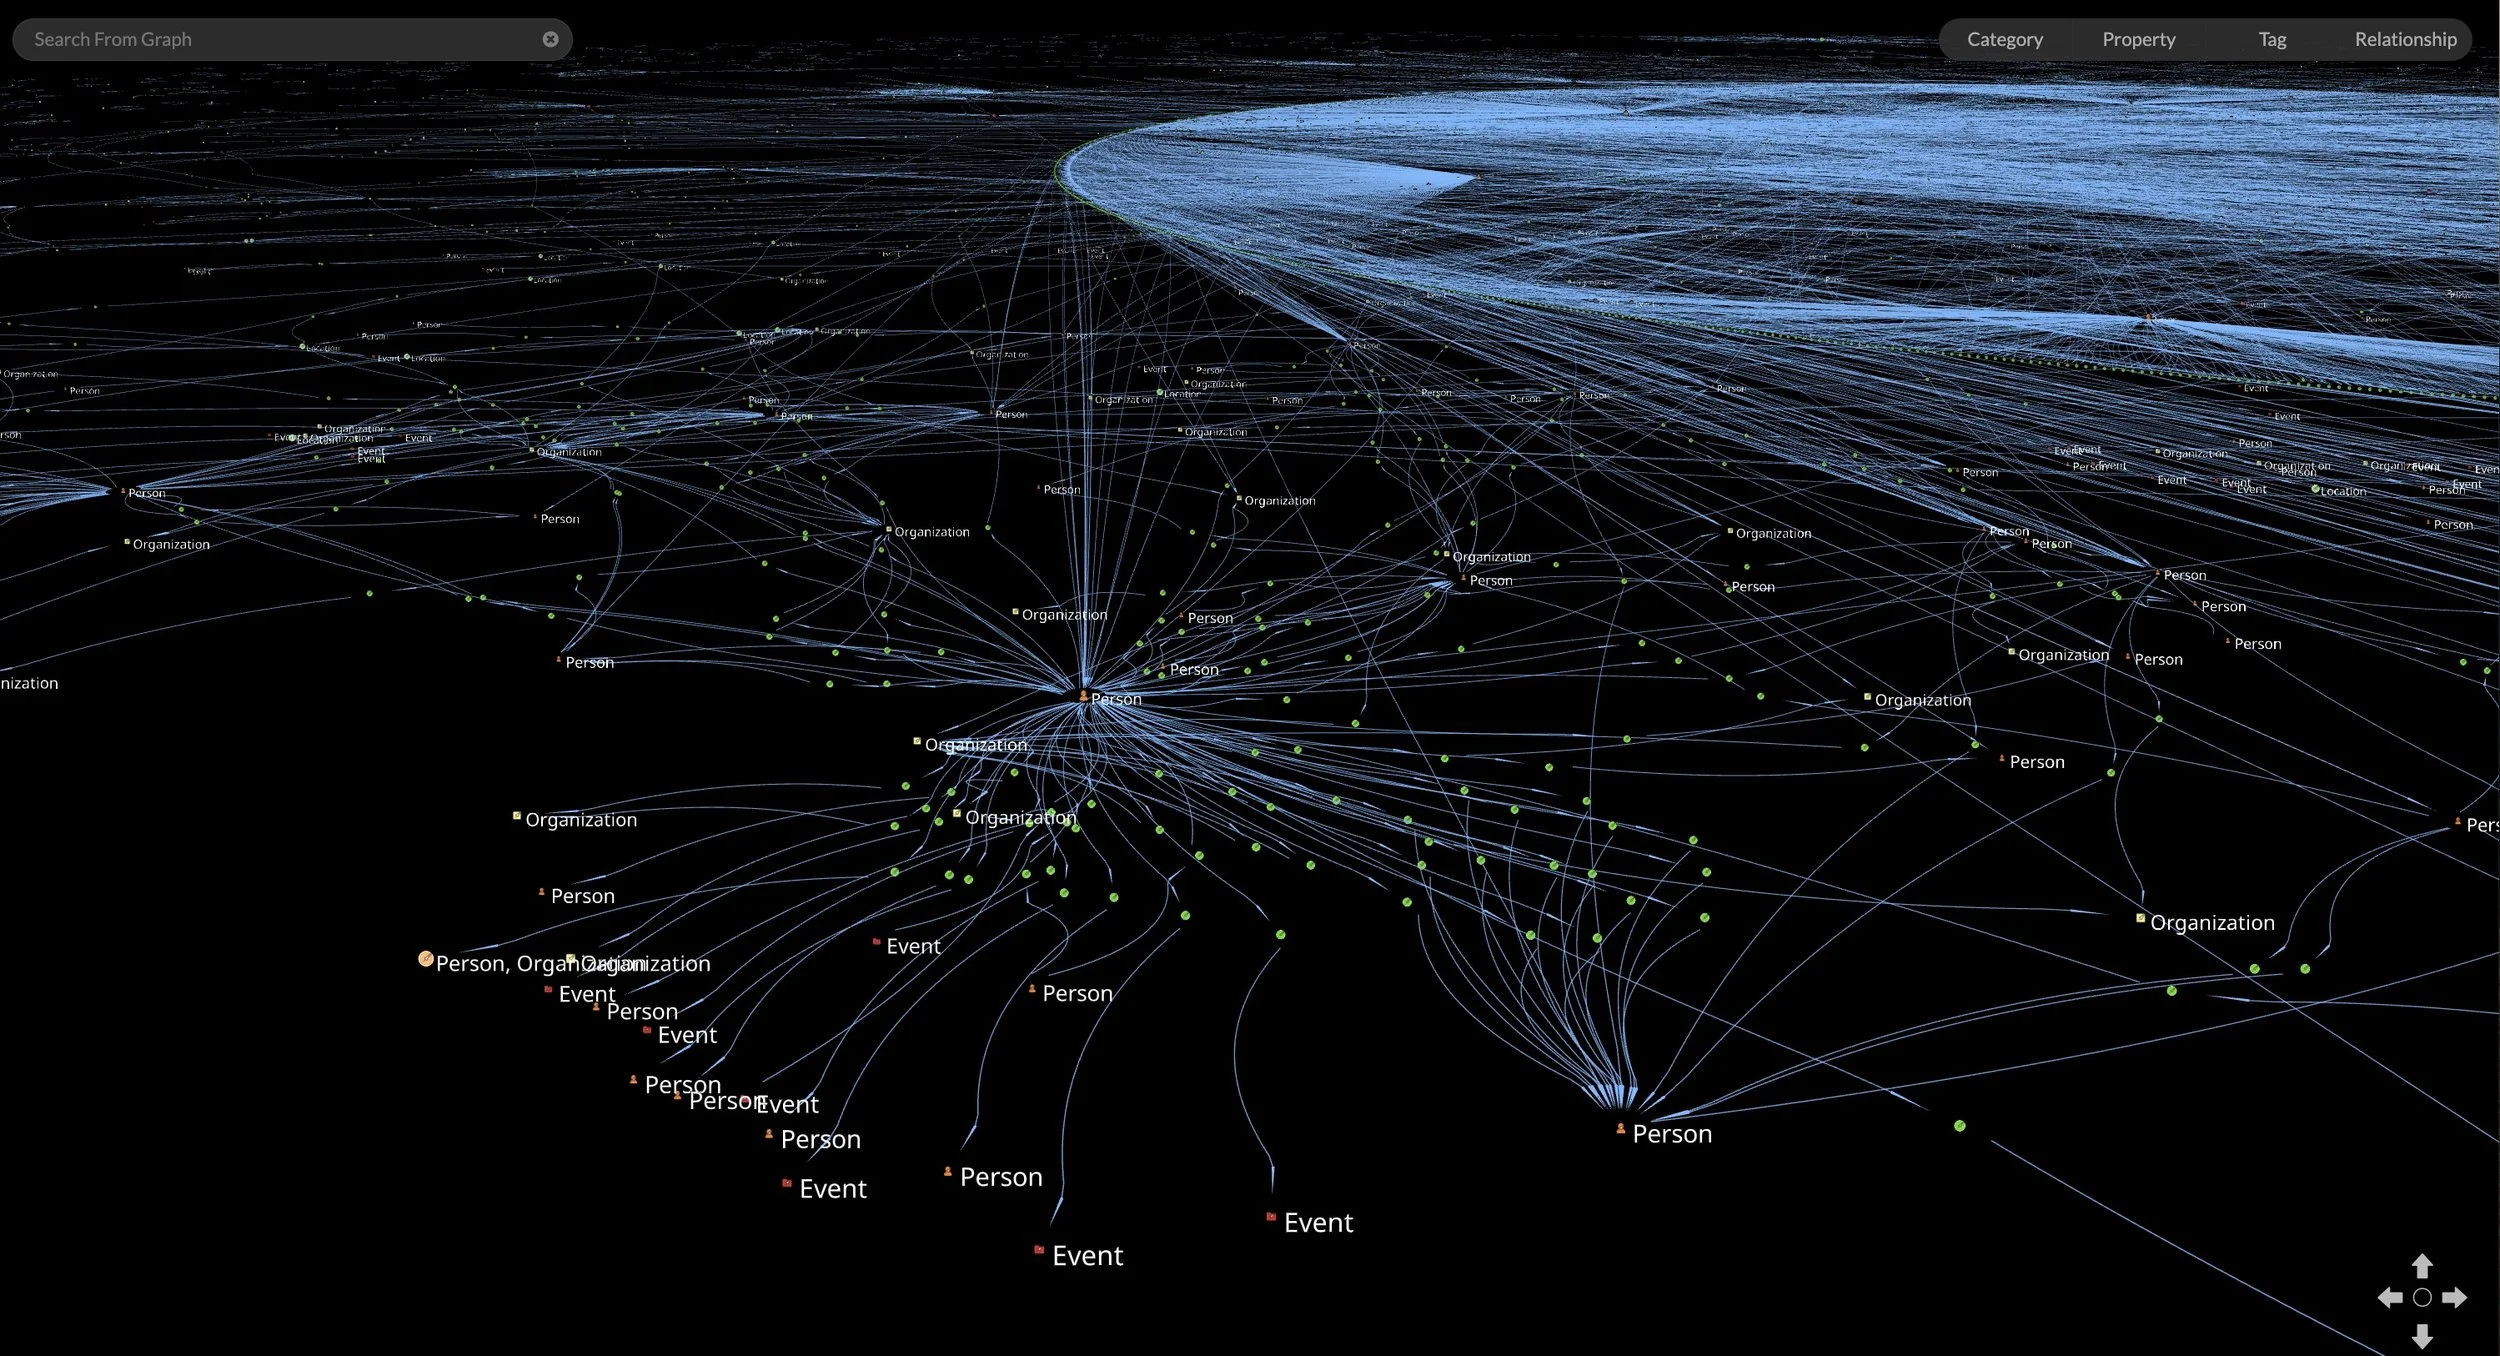
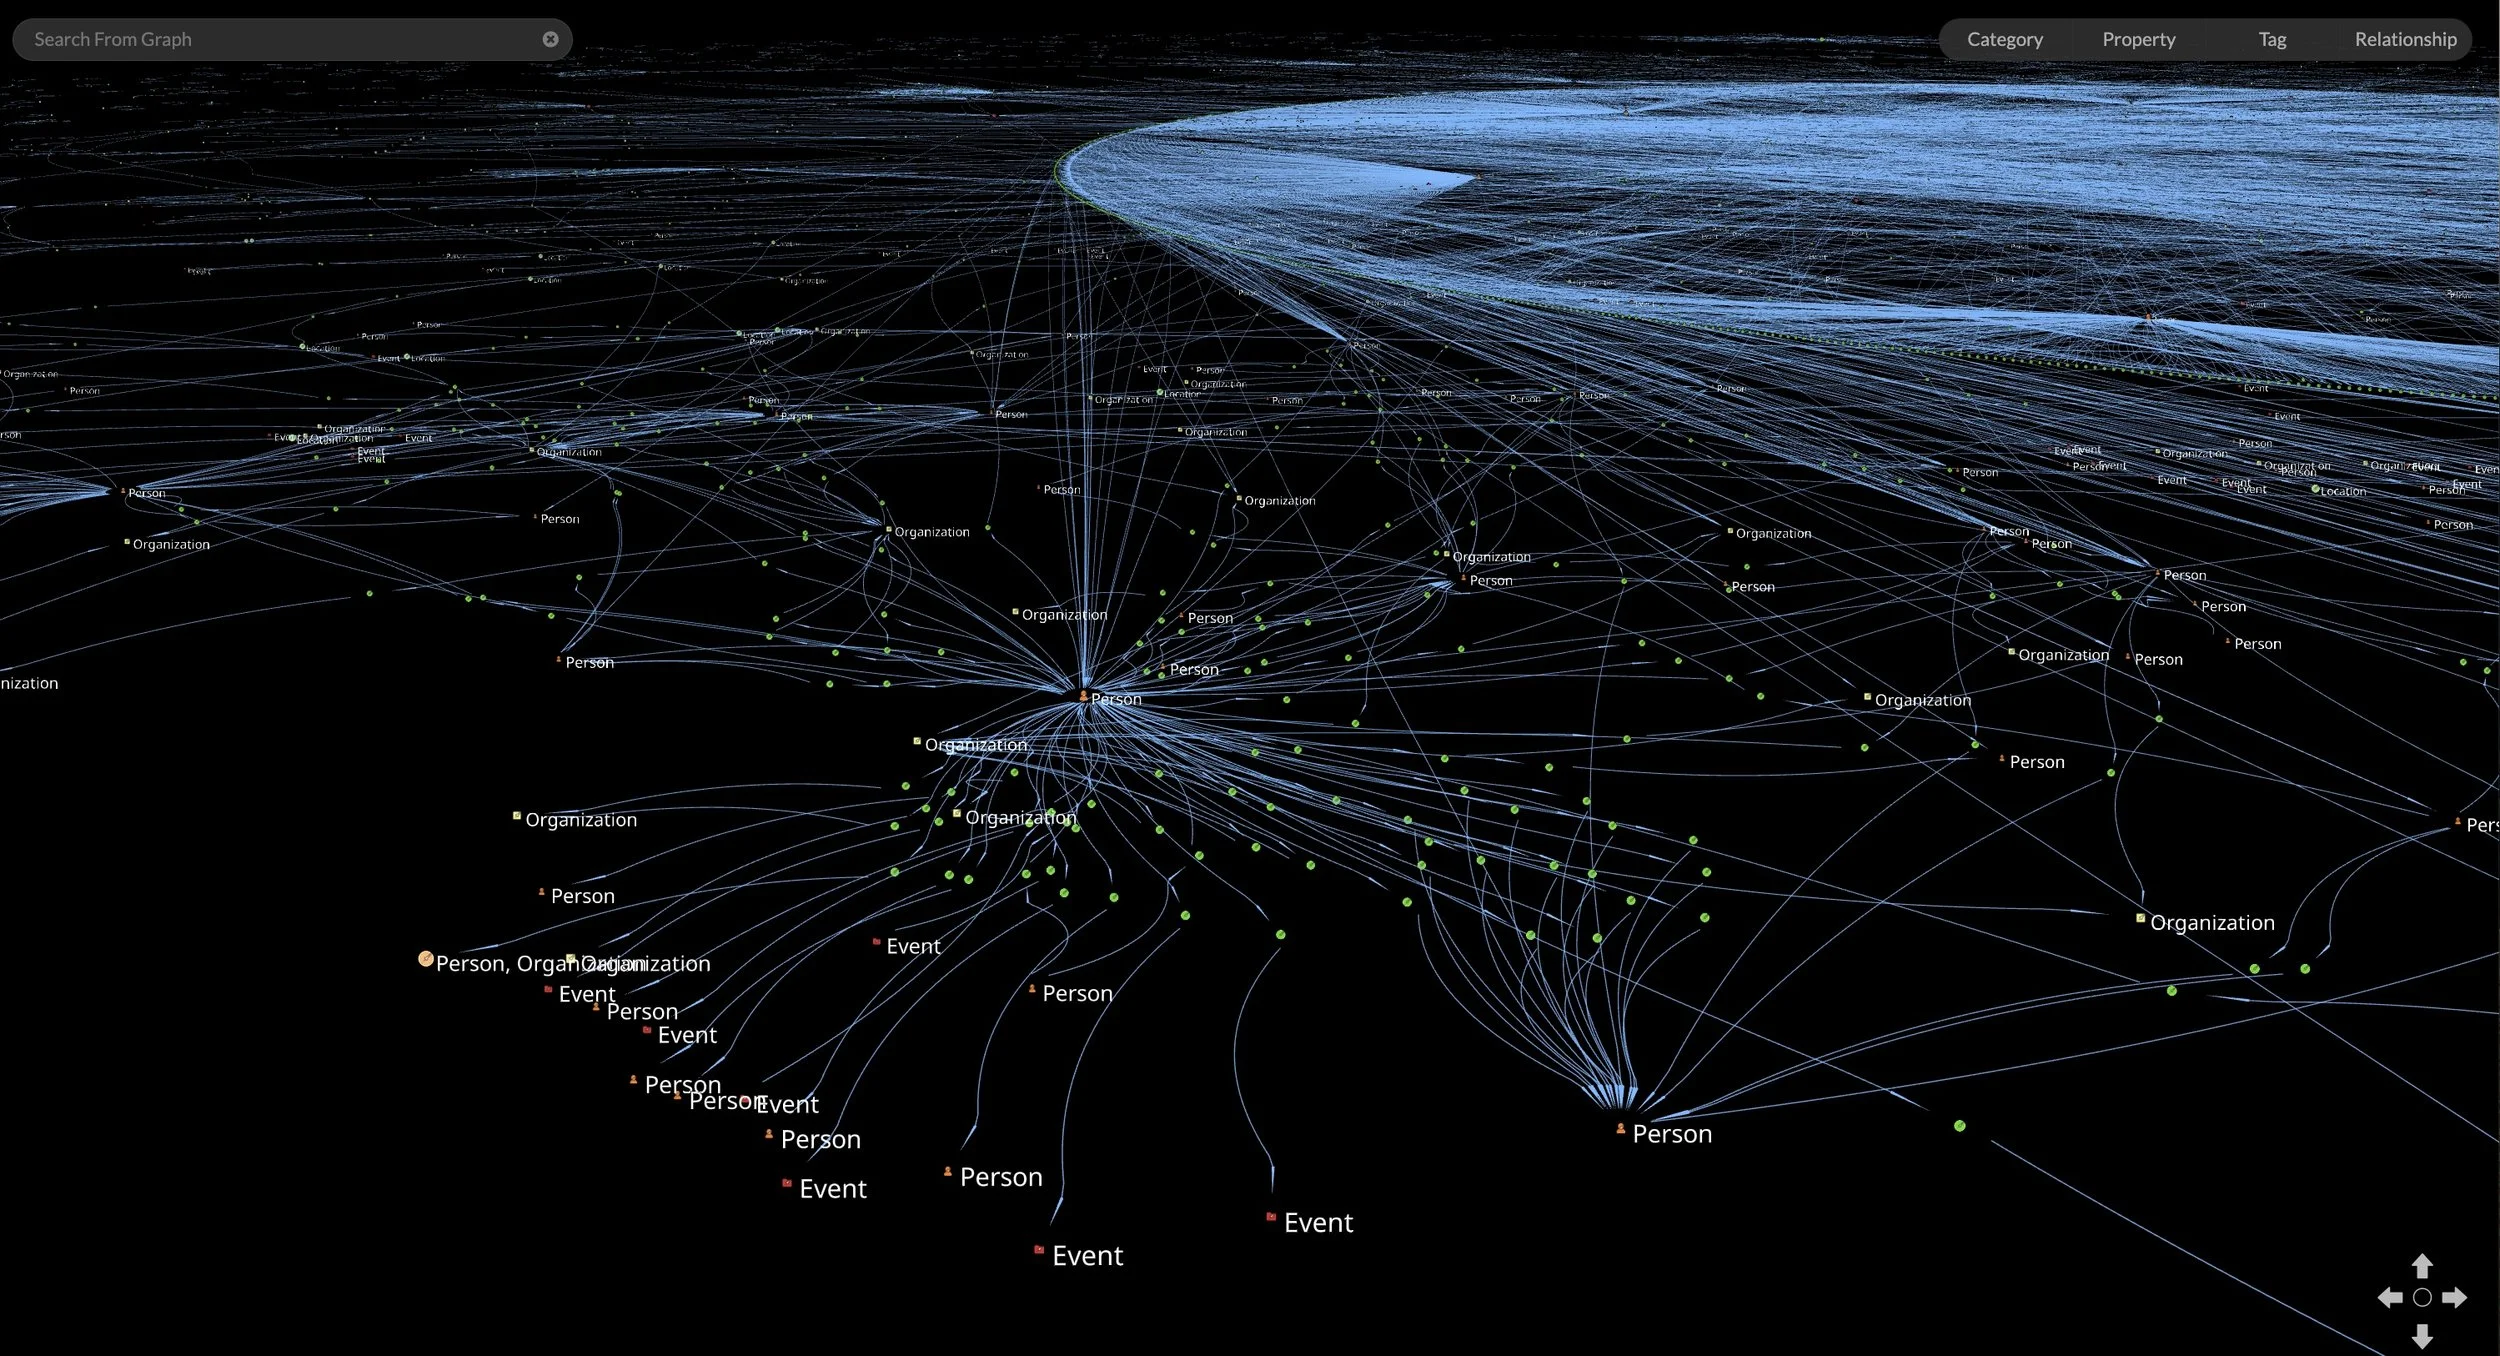
    An interesting use of warm data is the visualisation of the recently released Epstein case papers. This exercise was initially done for fun and interest, since then it has become a good training tool.

    When the data is visualised, we can start to determine patterns and linkages. We can see how simple text-based data can be easily converted to warm data – relationship data. We see relationships between organisations, people and events. We form observations. We see things that are not easily seen or can be overlooked by simply pulling or chunking text from a document or series of documents.

    Warm data visualised and in context is powerful.

  • Maximising the value of “Specific” and “Big” Data

    Maximising the value of “Specific” and “Big” Data

    Written by Jackie ‘O’Dowd

    In the race to harness the power of data to improve and transform, many small and medium size businesses are being led to believe the more data they have the better. However, for many small and medium size firms, we have found that big data often becomes part of the problem and not the solution. Having multiple systems in play, data stored in multiple locations, not being able to access the data needed and data quality issues are increasing challenges.

    The data and information we need to see, and use, depends on the task at hand and the choices and decisions we need to make. Sometimes we need to work with large data and information sets, and at others we need to work with smaller more specific data sets.

    “Specific data” as opposed to “Big Data” can require different approaches for collation, navigation, exploration and analysis. It’s not always about accumulating massive amounts of data and information, its about effectively using the data and information available, and quickly getting the best out of it.

    In a world where it is getting harder to make sense of things, in gaining visibility of the information we need; in getting things done under time-pressures, we need better ways to do things. Ways that will save time and provide the understanding, insight and context so we can be confident in the choices and decisions we make. We need visibility of the things that are important and matter when needed. 

    This is where specific data visualisation comes in. They allow us to take things such as single documents, multiple documents, spreadsheets, or system files and visualise and create models that quickly allows us to see and query content, understand relationships, linkages, and context. Prior to using tools like these analysing a complex 400-page document could take hours or days, we can now do it in minutes.  

    Data visualisation tools are fast becoming an approach of choice for non-technical users to better explore and analyse both specific and big data.

    If you want to put specific data to work and unearth quick insights from it, contact us and let us show you how.

  • Visualising Finance

    Visualising Finance

    Written by Jackie ‘O’Dowd

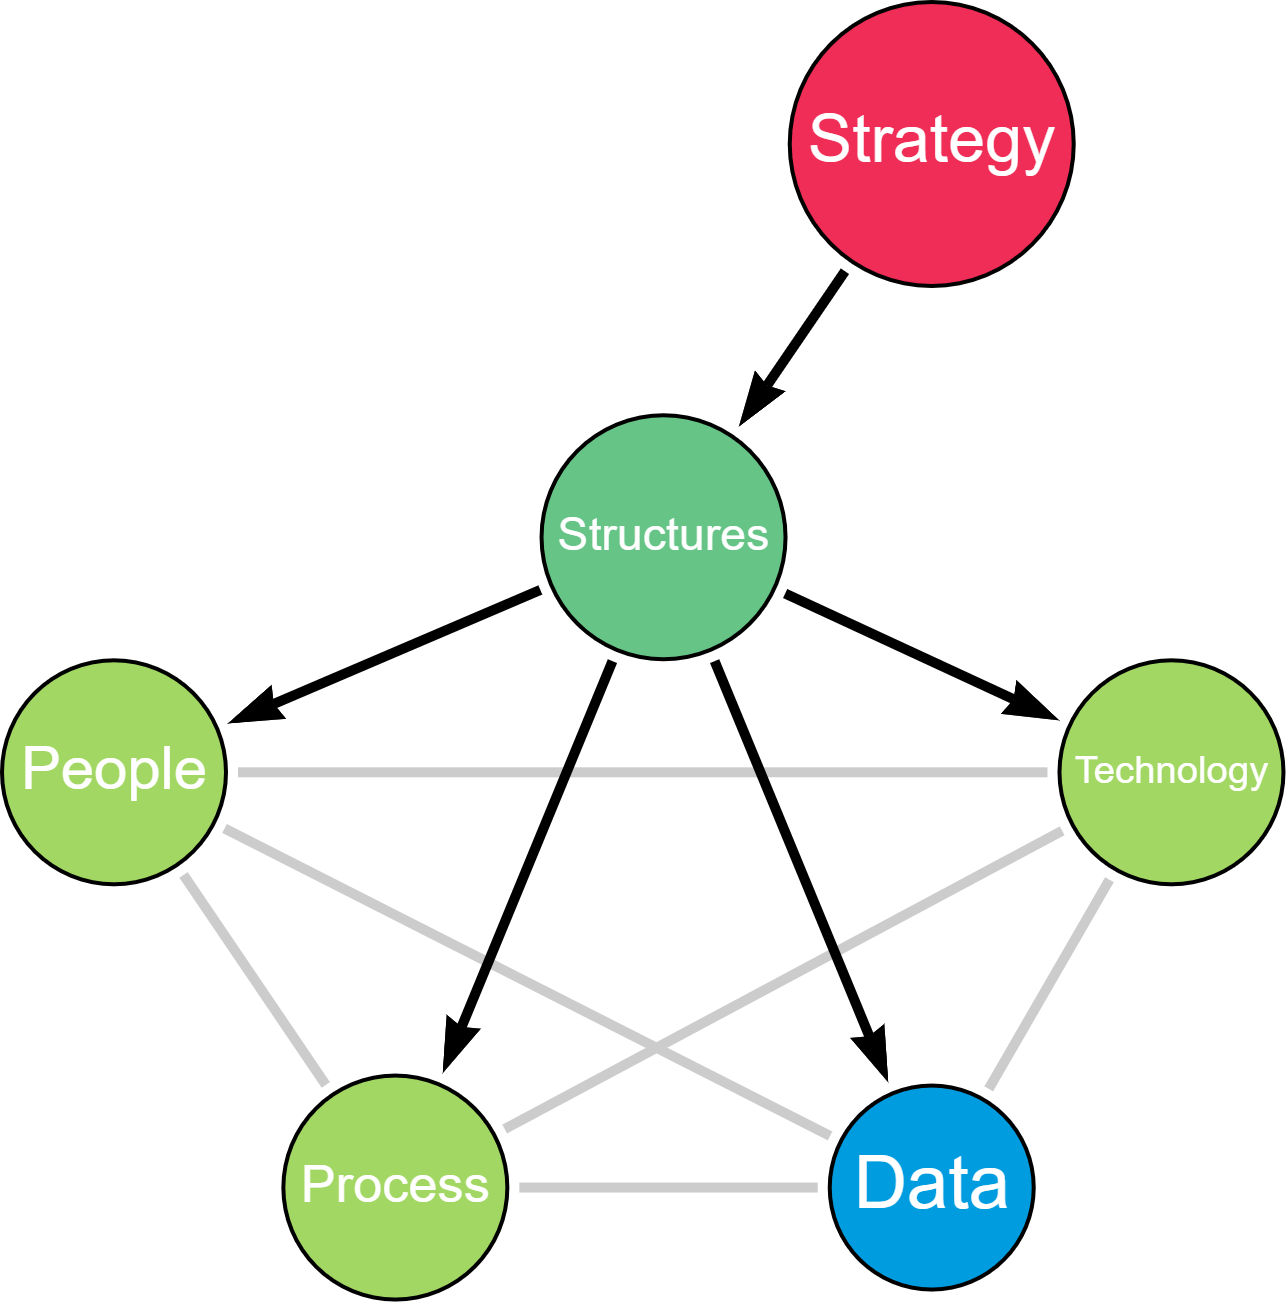
    Finance is the lifeblood of every business. The Chief Finance Officer plays a major part in the management of a company. The roles superpower is to acquire, manage and ensure the effective allocation, utilisation, and management of funds. Management Accountants on the other hand are responsible for accounting, reporting and control. Together these roles need to align the seven foundational elements of the organisation, Strategy, Structures, People, Process, Technology, Information, and Governance to drive performance, financial monitoring and control.

    Finance teams that leverage and align their seven foundational elements can unlock a number of key benefits and capabilities using them to drive operational improvements, minimise risk and better understand revenue and cost drivers. But too often, different business activities and functions do not align, data and information is in silo’s, and processes are not standardised, which means visibility across the entire organisation is difficult.  That is until now.

    Enterprise systems, spreadsheets and specialised systems have a role to play, they are the transactional engines. But today’s finance teams need a way to quickly highlight hidden patterns and anomalies, to extract insights from data and to be able to provide a sound narrative that tells the organisations financial data story. A data story that includes what costs are attributed to what product, service or activity; the risk classification and minimisation plan and what liabilities are beyond the balance sheet.

    Realising-Potential provides the alignment framework and data visualisation tools for finance teams to unlock the power of data and information and to improve the time from data to insight. Connecting the data dots enables more effective exploration, navigation, and observation. 

    Why does all of this matter? Here are several considerations:

    • The cost of not finding errors and anomalies can be high.

    • Putting information and narration in context for stakeholders is critical.

    • Repeatability of results when using AI and other emergent technologies is vital.

    • Visibility of data showing relationships and linkages puts it into context, resulting in greater understanding which leads to better choices and decisions being made.

    • Noise can produce economic loses.

    • Because the change happening today means tomorrow will be different.

  • How Cybernetics fits into the leadership and management sphere.

    How Cybernetics fits into the leadership and management sphere.

    Written by Jackie ‘O’Dowd

    Last week I had conversations with two different people from two different large organisations in two different industries. Both people were wanting to talk about their particular situation at work as I have known them for a long time.  Both are unhappy and vented their frustration, concern, and levels of anxiety emanating from their current roles. I listened for a while and together we started to talk through observations and questions. Reflecting on both conversations it has got me thinking about the impact of leadership, organisational structures, ineffective communication, and how we can be better at leading and managing everything a company does.

    Both people have been with their respective organisations for years not months, and share similar characteristics in that they are smart, committed, adaptable, collaborative and are very good at what they do. Interestingly, both have feelings of not being listened to, of being ignored and are feeling demotivated.

    Person A felt they have just wasted three months after being directed to manually enter data into a new system, when it could have been simply converted. The old system has more functionality and data capabilities than the new. When concerns were raised with the team manager, specific issues, impacts, opinions, and suggestions were ignored and simply shrugged off.

    Person B has been in the role for some time resulting in a deep knowledge of the organisation, how it works, its formal and informal power structures and culture. This person plays a key role in inducting senior leaders into the organisation and is what I call a super-connector. Over time frustration and an increasing dissatisfaction with decisions that have been made and how they are made is taking a toll. Lengthy automated processes taking the place of a more effective three-minute phone call adding to stress levels.

    We can all agree that a typical larger organisation of today is complex, frequently having a layered or matrix type structure, averaging 8 wide and 10 or more deep. As leaders, managers, and people in key roles in organisations like this, it’s easy to lose sight of what’s happening and to lose sense of how people work, contribute, and feel. Getting information can be difficult because stored in multiple systems and its generally presented in personalised, aggregated, and distilled forms. All too often we need to decode and interpret complex and often conflicting communication and miscommunication, and it seems like there is never enough time in which to do it.

    Enter Cybernetics as a frame for leadership and management in large complex organisational systems of people, process, technology, and information. I think it fits nicely into the organisational sphere by providing an approach for calibration, communication, control, and feedback – the things that create the conditions for connection, emotional intelligence, and performance. Things we need to understand, encourage and get to grips with as we work through the practicalities of how humans and new technologies interact and evolve.

  • Why we need Cybernetic leadership

    Why we need Cybernetic leadership

    Written by Jackie ‘O’Dowd

    Rapid technology advances, typical organisational dynamics, and the ever-increasing complexity of business means we have to continually embrace new methods and thinking to guide and shape the future of our organisations to provide effective leadership.

    Enter Cybernetics. Cybernetics is not new in fact it has been around since 1948, shaped by the thinking and intelligence of some incredibly qualified and forward-thinking problem solvers such as Norbert Weiner, W. Ross Ashby, Alan Turing, Stafford Beer, and evolved by others. I first came across Cybernetics when I completed a Master of Leadership and Management degree many years ago. Having a technology and management background I was intrigued by the level of  thinking and approach put into the Cybernetic convergence of natural (human and animal) and artificial intelligence (calculate and compute).

    The convergence of human and artificial intelligence is something we are all now having to factor into our organisations as tools such as ChatGPT, Co-Pilot and other automation tools are rolled out. The introduction of these types of tools means we require a leadership rethink and redesign as the world of work, and how we lead and manage is changing. Given the foundation of Cybernetics I believe it is an effective frame for leaders to adapt and use.

    Using a Cybernetic approach means seeing our organisations as living adaptive systems, with goals, structures, processes, capabilities, technologies, and vested interests. It requires new ways of thinking, leading and understanding how things really work.

    Basics such as communication, language used, and ways of working become integral for leading, managing and adapting how people and evolving technologies will interact and deliver value.

    Who said leadership was easy? It may look it, but it’s not, and it’s only going to get harder. Enter Cybernetic leadership and time for a rethink.

  • A Strategic Approach to Data

    A Strategic Approach to Data

    Written by Jackie ‘O’Dowd

    Data is one of the many raw materials that is used by every business. It has its own lifecycle. We base decisions on it, we repurpose it and reuse it, we leverage it.

    Data is an input to strategy, it shapes the business model, enables process intelligence, is used by people and technology and it benefits from a governance framework.

    Our research shows that organisations that have a strategic approach to data usually have a combination of:

    ·        Data by design.

    ·        Strong network effects.

    ·        Data driven insights.

    ·        A better understanding of people and systems interactions.

    More importantly, a strategic approach to data considers how data is used externally by and for the Customer. It also considers how it is used internally for the things we need to design, create, and deliver behind the scenes.

  • Effective and efficient project management with Mirella Luketich

    Effective and efficient project management with Mirella Luketich

    Jackie talks with Mirella Luketich on how effective and efficient projects require a good project manager and a sound project management approach, yet at times project management can be seen purely as an overhead and a thankless job.

    In this episode Mirella shares her extensive experience in setting up and managing Project Management Offices (PMO) in both the public and private sectors to drive benefits realisation and achieve a positive return on investment.

    Amongst other things we talk about establishing a PMO capability, good practice and the importance of practical things such as monitoring project burn rates. I hope you enjoy this episode.